-
PointClickCare: The Basics
- PointClickCare: The Basics
- Signing In and Signing Out of PointClickCare
- Internet Security with the PointClickCare Platform
- Logging a Support Case
- Changing Your Password
- Bulletin Board
- Communications Message Board for Care Staff
- Reviewing PointClickCare Announcements
- Using the PointClickCare Help Center
- Configurable Terminology in PointClickCare
- Installing MeadCo Script for Printing using Internet Explorer (IE) Quick Reference Guide
- Managing Pop Up Blockers
-
Clinical
-
General Clinical Setup
- Completing General Configuration
- Security for General Setup
- Managing Scoping
- Reviewing Admin General Configuration
- Reviewing Facility Configuration
- Reviewing Resident Identifiers
- Reviewing User Defined Fields
- Reviewing Pick Lists
- Reviewing Department/Position
- Reviewing Security Users
- Enabling Customer Specific Quick Link
- Reviewing the Strike Out Pick List
- Managing General Note Types
- Setting Up MPI Clinical Documentation (Historical Records)
- Setting Up Online Documentation Storage
- Managing Dashboard Layouts
-
Resident Information
- Admissions, Discharges, Transfers, and Room Changes
- Resident Information
- Profile Module Overview
- Resident Data - Physician Visits
- Scanning and Uploading Documents to the Resident Record
-
Dashboards and Reports
-
Dashboards
- Clinical Dashboard Overview
- Resident Dashboard Overview
- Editing the Dashboard Layout
- Create a New Dashboard Layout
- Identifying Incomplete Admission
- Overdue Waiting List Requests Dashboard Pane
- Daily Summary Dashboard Pane
- ADT Incomplete Census from the Clinical Dashboard
- ADT Dashboard Pane
- Resident Dashboard Census Summary
- Resident Photo Dashboard Pane
-
Reports
- Clinical Reports Overview
- Printing Reports
- Admit/Discharge To/From Report
- Action Summary Report
- Birthday List Report
- Resident List Report *New*
- Custom Resident Labels Report
- Language List Report
- Religion List Report
- Resident Contacts Report
- Resident Contacts Mailing Labels Report
- User Defined Information Report
- Transfer/Discharge Record Report
- Admission Record Report
- Transfer/Discharge Record *NEW* Report
- Transfer/Discharge Record (blank) *NEW* Report
- Online Documentation Storage Report
- Re-hospitalization (non-eINTERACT) Report
-
Dashboards
- Allergies
-
Analytics
- Analytics Setup
-
Analytics
-
Quality Indicators
- Quality Indicators Overview and Access
- Adding Custom Benchmarks and Settings
- Overview of Analytics Dashboards
- Interpreting the Corporate QI Dashboard
- Interpreting the Facility QI Dashboard
- Interpreting the Resident QI Dashboard
- Interpreting the QI Score Trend Dashboard
- Interpreting the QI Compare Dashboard
- Managing Quality Improvement Project
-
Clinical Key Performance Indicators
- CKPI Overview and Access
- Overview of CKPI Dashboards
- Adding Custom Benchmarks
- Interpreting the Corporate CKPI Dashboard
- Interpreting the Facility CKPI Dashboard
- Interpreting the Resident CKPI Dashboard
- Interpreting the Resident Characteristic CKPI Dashboard
- Interpreting the CKPI Trend Dashboard
- Interpreting the CKPI Compare Dashboard
-
Readmissions
- Overview and Accessing Readmissions Analysis
- Resident Stay Record
- Understanding Readmissions Analysis Calculations
- Setting Readmission Benchmarks
- Interpreting the Corporate Summary Dashboard
- Interpreting the Corporate Rate Detail Dashboard
- Interpreting the Corporate Average Length of Stay Dashboard
- Interpreting the Facility Dashboard
- Interpreting the Facility Average Length of Stay Dashboard
- Interpreting the Resident Listing Dashboard
- Interpreting the Average Length of Stay Resident Listing Dashboard
-
Quality Indicators
-
Assessments
-
Assessments Setup
- Overview of Assessments
- Security for Assessments
- Navigating the Custom Assessment Library
- Creating New Custom Assessments
- Adding Rules, Triggers, Style, and Lookbacks to Custom Assessments
- Creating Structured Progress Notes for Assessments
- Scoring and Setting Schedules for Assessments
- Adding Dependencies to Assessments
- Versioning and Copying Assessments
- Template Assessments for Long-Term Care
-
Assessments
- Navigating the Assmnts Tab Quick Reference Guide
- Creating Assessments
- Managing Acknowledgements, Errors, and Warnings
- Signing and Locking Assessments
- Section Status and Colour Coding in Assessments Quick Reference Guide
- Symbols in Assessments Quick Reference Guide
- Standard Question Types in Assessments Quick Reference Guide
- Assessments Reports
- Assessments Management
-
Assessments Setup
-
Care Plans
-
Care Plans Setup
- Overview of Care Plans
- Reviewing Admin and Clinical Setup for Care Plans
- Managing Terminology Configuration
- Managing Care Plan Configuration
- Managing Care Plan Library Items
- Creating Reasons for Care Plan Closure
- Creating Care Plan Types
- Managing Kardex
- Creating Standard Shifts
- Creating Standard Documentation Frequencies
- Managing Care Record Types
- Care Plans
- Care Plan Reviews
-
Care Plans Setup
-
Census for Clinical
- Census for Clinical Only - Update Census Entries Overview
- Census for Clinical - Updating Incomplete Census
- Census for Clinical Only – Delete Census Entry
- Census for Clinical Only – New Census Entry
- Viewing Empty Beds
- Creating New Resident
- Viewing ADT Revisions
- Viewing Beds with Multiple Occupants
- Action Summary Report
- Detailed Monthly Census Report
- Clinical Chart
-
Dashboards
- Active Allergies Dashboard Pane
- Active Diagnoses Dashboard Pane
- Activities of Daily Living Dashboard Pane
- Administered PRN Medication Audit Dashboard Pane
- ADT Dashboard Pane
- Advance Directive Dashboard Pane
- All Conversations Dashboard Pane
- Blood Pressure Graph Dashboard Pane
- Care Plan Goals Overdue/Due Dashboard Pane
- Care Plan Reviews Overdue/Due Dashboard Pane
- Clinical Alerts Dashboard Pane
- Current CMI (MDS 2.0) Dashboard Pane
- Daily Summary Dashboard Pane
- Diagnosis Notification Dashboard Pane
- Diet Dashboard Pane
- Event Calendar Worklist Dashboard Pane
- General Notes Dashboard Pane
- High Priority Progress Notes Dashboard Pane
- Immunization Issues Dashboard Pane
- Incomplete Care Plans Dashboard Pane
- Incomplete Census Dashboard Pane
- MDS Scores (MDS 2.0) Dashboard Pane
- Med Passes in the Last 24 hours Dashboard Pane
- Medications Dashboard Pane
- Most Recent Vitals Dashboard Pane
- Number of Active and On Hold Medication Schedules for Each Resident Dashboard Pane
- Order Alerts Dashboard Pane
- Orders on Hold > 30 Days or Requiring Reassessment Dashboard Pane
- Orders Pending Signature Dashboard Pane
- Orders Review Dashboard Pane
- Overdue Waiting List Requests Dashboard Pane
- Physician Visits Dashboard Pane
- POC Assignment Status Dashboard Pane
- POC Unscheduled Task Alerts Dashboard Pane
- Proceed to Care Plan RAPs/CAPs Dashboard Pane
- Progress Notes in Last 30 Days Dashboard Pane
- Quality Indicators and Quality Measures (MDS 2.0) Dashboard Pane
- Resident Photo Dashboard Pane
- Scheduled Events Dashboard Pane
- Therapy Minutes Summary Dashboard Pane
- UDA Scores Dashboard Pane
- Undocumented PRN Orders > 30 Days Dashboard Pane
- Unreviewed Laboratory Results Dashboard Pane
- Unreviewed Radiology Results Dashboard Pane
-
EHR Scorecard
- EHR Scorecard Setup
-
Using EHR Scorecard
- Overview of EHR Scorecard
- Stage 1 – ADT
- Stage 1 – Allergies
- Stage 1 – Transaction Processing
- Stage 1 – Diagnosis
- Stage 1 – MDS
- Stage 2 – Care Plans
- Stage 2 – Basic Assessments
- Stage 2 – Weights and Vitals
- Stage 3 – Point of Care Documentation
- Stage 4 – Order Management
- Stage 4 – Progress Notes
- Stage 5 – Orders Integration
- Percentile Report
- Absolute Values Report
- eINTERACT
-
eMAR
- eMAR Setup
-
eMAR
- Logging In and Out of eMAR
- Navigating the eMAR Quick Reference Guide
- Navigating the Resident's Chart in eMAR Quick Reference Guide
- Navigating the Administrations in eMAR Quick Reference Guide
- Color Coding and Symbols in eMAR Quick Reference Guide
- Using Advanced Filters in eMAR
- Documenting Scheduled Orders in eMAR
- Setting Reminders in eMAR
- Apply Chart Code to All Administrations
- Documenting PRN Orders in eMAR
- Documenting Follow Up for PRNs in eMAR
- Striking Out Documentation in eMAR
- eMAR Reports and Dashboards
- eMAR Order Supply Management
- Hospital Tracking Portal
- Immunizations
- LTC eConnect
-
MDS 2.0
-
MDS 2.0 Setup
- Overview of MDS 2.0
- Security for MDS 2.0
- Reviewing Admin and Clinical Setup for MDS 2.0
- Completing MDS 2.0 Configuration
- Completing MDS Configuration
- Managing MDS 2.0 Triggers, Warnings and Look Backs
- Completing Integrated Assessment Record (IAR) Configuration
- Overview of Therapy Minutes
- Security for Therapy Minutes
-
MDS 2.0
-
MDS Data Entry
- Overview of MDS 2.0
- MDS 2.0 Tab Overview
- Creating New MDS 2.0 Assessment
- Copying an MDS 2.0 Assessment
- MDS 2.0 RUG Optimizer
- MDS 2.0 Section Listing
- MDS 2.0 Review of Sections
- Colour Coding in MDS 2.0
- MDS 2.0 - Symbols Legend
- MDS 2.0 Data Autopopulation and Auto Validation of Questions
- MDS 2.0 Refresh Data
- Opening the RAI-MDS 2.0 Manual
- MDS 2.0 Question Types Overview
- MDS 2.0 Errors and Warnings
- Completing MDS 2.0 Sections
- MDS 2.0 Portal - In Progress View
- MDS 2.0 - Section V
- Locking the MDS 2.0 Assessment
- Printing MDS 2.0
- Overview of Submissions
- MDS 2.0 Batches Portal
- MDS 2.0 - Submissions - Create a Contact Information File
- MDS 2.0 - Submissions - Create a Batch
- MDS 2.0 Portal Overview
- MDS 2.0 Scheduler
- MDS 2.0 Case Mix Analyzer
- Closing an MDS 2.0 Assessment
- MDS 2.0 - Strike Out an MDS Assessment
- MDS 2.0 Kardex
- RAPs/CAPs
-
MDS Submissions
- Overview of Submissions
- MDS 2.0 Batches Portal
- MDS 2.0 - Submissions - Create a Contact Information File
- MDS 2.0 - Submissions - Create a Batch
- MDS 2.0 - Submissions - Export a Batch
- Record Results for Batch Submissions
- MDS 2.0 - Submissions - Revise Recorded Results
- MDS 2.0 - Submissions - Correcting Accepted Assessments
- MDS 2.0 - Submissions - Correct an Assessment with Effective Date Prior to April 1, 2012
- Deleting Accepted Assessments
- MDS 2.0 - Submissions - Health Record Number (A6a) Troubleshooting
- MDS 2.0 - Submissions - Admission Date (AB1) Troubleshooting
-
Monitoring and Managing
- Monitoring and Managing
-
Reports and
Dashboards
- MDS 2.0 - Resident Dashboard - Clinical Alerts
- MDS 2.0 - Resident Dashboard - Activities of Daily Living
- MDS Scores (MDS 2.0) Dashboard Pane
- MDS 2.0 Resident Dashboard Scheduled Events
- MDS 2.0 - Clinical Dashboard - Clinical Alerts
- Integrated Assessment Record (IAR) – Entering Consent – MDS Tab
- Integrated Assessment Record (IAR) – Entering Consent – MDS Assessment
- Proceed to Care Plan RAPs/CAPs Dashboard Pane
- Current CMI (MDS 2.0) Dashboard Pane
- Quality Indicators and Quality Measures (MDS 2.0) Dashboard Pane
- MDS 2.0 - Resident Dashboard - New Quality Indicators and Quality Measures
- Assessment History Report
- Assessment Scoring Report
- Assessment Warnings Report
- Case Mix Detail Report
- Resident Response Analyzer Report
- Resident Response List Report
- Resident Response Comparison Report
- MDS 2.0 Kardex Report
- MDS 2.0 Clinical Summary Report
- MDS QI Report/MDS QI Report V2.0
- MDS 2.0 QI Extract Report
- MDS 2.0 RAPs Summary Report
- RAPs Quarterly Summary Report
- RUGs Summary Report
- RUG Weighted Patient Days (RWPD) Report
- MDS 2.0 Quality Indicator Quarterly Comparison Report
- Look Back Report
- Missing Entries for Assessments Report
- MDS 2.0 Enterprise Reports - Quality Indicator Corporate Comparison Report
-
MDS Data Entry
-
MDS 2.0 Setup
- MDS Analytics
-
Medical Diagnosis
- Medical Diagnosis Setup
-
Medical Diagnosis
- Medical Diagnosis Overview
- Adding a Medical Diagnosis
- Medical Diagnosis - Update or Resolve Existing Diagnosis
- Strike out a Diagnosis
- Filtering and Sorting Medical Diagnosis
- Medical Diagnosis - Rank and Classification Overview
- Medical Diagnosis Notifications Overview
- Managing Diagnosis Notifications
- Diagnosis Notification Dashboard Pane
- Medical Diagnosis Audit Report
- Active Diagnoses Dashboard Pane
- Medical Diagnosis Report *New*
- Medical Diagnosis Report
- Medical Diagnosis - Missing Entries Report
-
Nutrition Management
- Nutrition Management Setup
- Nutrition Management
- Residents
-
Menus
- Overview of Menus
- Navigating the Menu Entry Screen
- Menu Builder
- Order Manager
- Meal Orders
- Meal Order Screen
- Ticket Dashboard
- Production
-
Reports
-
Residents Reports
- Resident Listing Report
- On Hold Listing Report
- Birthday Report
- Diet Order Tally Report
- Diet Order Conflict Report
- Unique Diet Order Combination Report
- Residents with No Texture Report
- Residents with No Special Diet Report
- Resident Summary Report
- Resident Details Report
- Meal Distribution Report
- Tray Cards Report
- Dislike Tally Report
- Adaptive Equipment Tally Report
- Dining Location Assignment Report
- Resident Alert Tally Report
- Menu Type Listing Report
- Selective Menus Report
- Diet Order Changes Report
- Standing Order Labels Report
- Standing Order Lists Report
- Standing Order Tally Report
- Menu Reports
-
Production Reports
- Ingredient Listing Report
- Ingredient/Recipe Find Report
- Ingredient Usage Report
- Recipe Listing Report
- Pre-Purchased Recipe Listing Report
- Menu Item - Recipe Links Report
- Recipe Not Required Report
- Multi–Recipe Printing Report
- Multi-Serve Recipe Printing Report
- Recipe Books Report
- Production Notes Report
-
Residents Reports
- Administrator Reports
-
Orders Management
-
Orders Setup
-
Orders Setup
- Security for Orders Management
- Reviewing Admin and Clinical Setup for Orders Management
- Security Role Based Alerts Configuration
- Completing Orders Configuration
- Creating Standard Shifts
- Managing Standard Time Codes
- Managing Custom Medications
- Managing Orders Pick Lists
- Importing Order Templates
- Managing Order Templates and Sets
- Setting Up Formularies
- Setting Up Advanced Formulary Management
-
Setting Up
Electronic Signatures for Orders in the Web
- Setting Up Electronic Signatures for Orders in the Web Quick Reference Guide
- Viewing Electronic Signature Configuration
- Linking Medical Professionals to Security Users
- Reviewing Order Review Dates for Electronic Signature
- Security for Electronic Signatures for Orders in the Web
- Enabling Orders Pending Signature
- Managing Device Tokens for Users
- Setting Up Clinical Order Review
- Creating and Managing Pharmacies and Other External Facilities
-
Orders Setup
-
Orders
- Order Entry
- Managing Orders
- Electronic Order Signature and Order Reviews for Practitioners
- Monitoring Order Signatures and Order Reviews
-
Dashboards and Reports
- Dashboards
-
Reports
- Administration Record Report
- Diet Type Report
- Drug Record Book Report
- Formulary Item Listing Report
- Ontario Lab Report
- Lab and Diagnostic Record Report
- Medication Review Report
- Order Listing Report
- Order Recap Report
- Order Review History Report
- Order Summary Report
- Pharmacy Admission Report
- Pharmacy Discharge Report
- Pharmacy Requisition Report
- Printed Prescriptions Report
- Printed Prescription for Wet Signature Report
- Order Review Report
- PRN Sheets Report
- Telephone/Verbal Order Form Report
- Telephone/Verbal Order Signature Details Report
- Side Effect Care Records Report
- Resident Medication Count Report
-
Integrated Medication Management (IMM)
- Introduction to Integrated Medication Management
-
Order Management
with IMM
- Managing Clean up of Pharmacy Orders (IMM): Video
- Managing Clean Up of Pharmacy Orders for Integrated Medication Management Quick Reference Guide
- Best Practices for Monitoring: Video
- Monitoring Pharmacy Orders for Integrated Medication Management Quick Reference Guide
- Requesting Reorder
- Confirming Orders
- Confirming Orders Quick Reference Guide
- Medications/Supplies Returned to Pharmacy
- Reviewing Orders in the Follow-up Tab
- Therapeutic Interchange
- Pharmacy Orders that must be Faxed to Pharmacy
- Pharmacy Orders that must be Faxed to Pharmacy Quick Reference Guide
-
Managing
Pharmacy Initiated Orders
- Overview of Pharmacy Initiated Orders
- Managing Pharmacy Initiated Orders
- Reviewing and Confirming Pharmacy Initiated Orders Quick Reference Guide
- Holding Orders
- Resuming Orders
- Creating STAT Pharmacy Initiated Orders
- Creating Off Hours Pharmacy Initiated Orders
- Monitoring Pharmacy Category Orders for Pharmacy Initiated Orders Quick Reference Guide
-
Scanning and
Receiving with IMM
- Waiting to be Received Overview
- Electronically Receiving Overview
- On Order (ELECTRONIC) Overview
- Electronically Receiving Orders
- Manually Receiving Orders with On Order (Electronic) status
- Auto-Receiving Orders
- Receiving Supply Messages (without Scanner) Quick Reference Guide
- Receiving Supply Messages (Electronically) Quick Reference Guide
- Matching Residents and Linking Orders with IMM
- Troubleshooting
-
Orders Setup
-
Paper ADL Documentation
- Paper ADL Docmentation Setup
-
Paper ADL Documentation
- Overview of Paper ADL Documentation
- TASKS (PAPER) - Add Tasks to the Care Record for Documentation
- TASKS (PAPER) - Personalize tasks
- TASKS (PAPER) - Add Tasks/Interventions from the Care Plan
- TASKS (PAPER) - Delete a Task
- TASKS (PAPER) - Resolve or Cancel a Task
- TASKS (PAPER) - Add Tasks Previously Resolved/Cancelled
- TASKS (PAPER), Custom Tasks - Overview of Custom Tasks
- TASKS (PAPER) Creating a Custom Task
- TASKS (PAPER) - Link Progress Note
- TASKS (PAPER) - Icons and Abbreviations
- TASKS (PAPER) - Produce a Task Care Record
- Intervention/Task Schedule Report
-
Point of Care (POC)
-
Point of Care (POC) Setup
- Overview of Point of Care (POC)
- Security for POC
- Reviewing Admin and Clinical Setup for POC
- Assigning Passwords in POC
- Assigning Initials and Department/Position
- Completing Task Configuration
- Creating Standard Shifts
- Completing POC General Configuration
- Setting up Care Plans in POC
- Creating Standard Documentation Frequencies
- Managing Icons, Tasks and Care Plan Items in POC
- Managing POC Alerts
- Managing POC Follow Up Questions
- Managing Kardex
- Managing Standard Assignments Groups and POC Assignments
- Managing Care Record Types
- Managing MDS Look Backs
- Managing Look Back Report Setup
- Managing POC Kiosks
- Enabling Task Manager
- Setting Up POC Service Time Tracking
-
Point of Care (POC)
- Logging In and Out of the Point of Care (POC) Mobile App
- Navigating Point of Care (POC) Mobile Quick Reference Guide
- Logging In and Out of the Point of Care (POC) Kiosk
- Navigating the Point of Care (POC) Home Tab Quick Reference Guide
- Navigating the Point of Care (POC) Shift Dashboard Tab Quick Reference Guide
- Colour Coding in Point of Care (POC) Quick Reference Guide
- Navigating the Point of Care (POC) Tab Quick Reference Guide
- Navigating the Point of Care (POC) Resident Care Record Quick Reference Guide
- Understanding Frequencies in Point of Care (POC) Quick Reference Guide
- Documenting Through the Resident Care Record in Point of Care (POC)
- Documenting Resident Not Available For All Tasks in Point of Care (POC)
- Creating Alerts in Point of Care (POC)
- Documenting Through Quick Entry in Point of Care (POC)
- Documenting Unscheduled Tasks in Point of Care (POC)
- Point of Care (POC) Reports
-
Point of Care (POC) Task Management
- Overview of POC Task Management
- Icons and Abbreviations on the POC Task Tab
- Add New POC Tasks from Task Library
- Personalizing POC Tasks
- Change Task Frequency in POC
- Modify Task Schedule in POC
- Delete a Task in POC
- Resolve or Cancel a Task for a Resident in POC
- Resolve a Task for All Residents in POC
- Adding POC Tasks Previously Resolved/Cancelled
- POC Review Unscheduled Task
- Documentation of Restorative Interventions from the Care Plan in POC
- Overview of Custom Tasks in POC
- Creating a Custom POC Custom Task
- Link a Progress Note to a Task in POC
- Link POC Care Plan Focus to a Task
- Census and POC
- System Generated/Cancelled Tasks Quick Reference Guide
- Task Manager
- Dashboards
-
Reports
- Task Care Record Report
- Kardex Report
- Intervention/Task Schedule Report
- Task List Report
- Assignment Location List Report
- Audit Report
- Follow Up Question Report
- Documentation Survey Report V2
- Look Back Report
- Nutrition Report (Advanced Report)
- Priority Report (Advanced Report)
- Response Rate Report
- Signature List Report (POC)
- Trigger Summary Report (Advanced Report)
- Behavior Report (Advanced Report)
- Alert Listing Report
- POC Documentation Compliance Report
- Task Library Report
- Service Schedule Report
- Actual vs. Planned Service Time Utilization by Resident Report
- Actual vs. Planned Service Time Utilization by Shift Report
- Actual vs. Planned Service Time Utilization by Task for a Resident Report
- Planned Service Time Utilization Report
- Planned Service Time Utilization by Task and Shift
-
Point of Care (POC) Setup
- Progress Notes
-
Reporting
- 24hr Summary Report
- Action Summary Report
- Actual vs. Planned Service Time Utilization by Resident Report
- Actual vs. Planned Service Time Utilization by Shift Report
- Actual vs. Planned Service Time Utilization by Task for a Resident Report
- Administration Record Report
- Admission Record Report
- Alert Listing Report
- Admit/Discharge To/From Report
- Allergy Audit Report
- Allergy/Reaction Library Report
- Allergy Report
- Assessment History Report
- Assessment Report
- Assessment Schedule Audit Report
- Assessment Schedule Cancellation Report
- Assessment Scheduling Report
- Assessment Scoring Report
- Assessment Warnings Report
- Assignment Location List Report
- Behavior Care Records Report
- Behavior Report (Advanced Report)
- Birthday List Report
- Care Record Report
- Care Plan Report
- Focus Summary Report
- Care Plan Item/Task Listing Report
- Care Plan Library Report
- Care Plan Reviews Due Report
- Case Mix Detail Report
- Change Log Report
- Current Weights and Vitals Report
- Custom Resident Labels Report
- Detailed Census Report
- Diet Type Report
- Documentation Survey Report V2
- Drug Record Book *New* Report
- Electronic Transmission Report
- Event Calendar Comparison Report
- Event Calendar Report
- Follow Up Question Report
- Formulary Item Listing Report
- General Notes Report
- Generated History Report
- Generating a Clinical Chart
- Immunization Audit Report
- Immunization Report
- Incident Analysis Report
- Incident Audit Report
- Intervention/Task Schedule Report
- Kardex Report
- Lab and Diagnostic Record Report
- Lab Results Report
- Language List Report
- Location of Administration Report
- MD/Nursing Communications Report
- MDS 2.0 Clinical Summary Report
- MDS 2.0 Kardex Report
- MDS 2.0 RAPs Summary Report
- MDS QI Report/MDS QI Report V2.0
- Medical Diagnosis Audit Report
- Medical Diagnosis Report
- Medical Diagnosis Report *New*
- Medical Professionals Mailing Labels Report
- Medical Professionals Resident Listing Report
- Medication Admin Audit Report
- Medication Review Report
- Midnight Census Report
- Midnight Census Report *New*
- Missing Entries for Assessments Report
- Monthly Weight Report
- Mood and Behaviour Report
- Nutrition Report (Advanced Report)
- Online Documentation Storage Report
- Ontario Lab Report
- Order Audit Report
- Order Listing Report
- Order Recap Report
- Order Review Report
- Order Review History Report
- Order Summary Report
- Pharmacy Admission Report
- Pharmacy Discharge Report
- Pharmacy Requisition Report
- POC Documentation Compliance Report
- Printed Prescriptions Report
- Priority Report (Advanced Report)
- PRN Sheets Report
- Progress Notes Report
- Progress Notes Report *New*
- Radiology Results Report
- Religion List Report
- Resident Contacts Mailing Labels Report
- Resident Contacts Report
- Resident List Report
- Resident List Report *New*
- Resident Response Analyzer Report
- Resident Response Comparison Report
- Response Rate Report
- RUG Weighted Patient Days (RWPD) Report
- RUGs Summary Report
- Service Schedule Report
- Shift Report
- Side Effect Care Records Report
- Signature List Report (Orders)
- Signature List Report (POC)
- Task Care Record Report
- Task Library Report
- Telephone/Verbal Order Form Report
- Telephone/Verbal Order Signature Details Report
- Therapy Minutes Report
- Therapy Minutes Report *New*
- Transfer/Discharge Record *NEW* Report
- Transfer/Discharge Record Report
- Trigger Summary Report (Advanced Report)
- User Defined Information Report
- Weight Calculations Range Report
- Weight Summary Report
- Weights and Vitals Exception Report
- Weights and Vitals Summary Report
-
Resident Event Calendar
- Resident Event Calendar Setup
-
Resident Event Calendar
- Resident Event Calendar Overview
- Resident Event Calendar – Access
- Resident Event Calendar – Navigation Items
- Creating a New Event in the Resident Event Calendar
- Cancelling Events on the Resident Event Calendar
- Edit Resident Event Calendar
- Resident Event Calendar – Marking Attendance and Progress Notes
- Results
- Risk Management
-
Secure Conversations
- Secure Conversations Setup
-
Secure Conversations
-
Secure Conversations in the Web
- Secure Conversations Overview
- Message Lifespan Expiry
- Conversation Types Overview
- Home - My Conversations
- Quick Link - Message Bubble
- Resident-centric Conversations - Resident Header
- All Conversations Dashboard Pane
- New Resident-centric Conversation
- Receiving Conversations and Messages
- Photos Overview
- Creating a Progress Note from Resident-centric Conversations
- Upload Photos to Resident-centric Conversations
- New General Conversations
- New Cross-Facility Conversations
- Leave Conversation
- Ending a Conversation
- Set Urgency
- Unavailable Message
- Notifications in the Mobile App
- TigerText App on Mobile Devices
-
Secure Conversations Mobile
- Secure Conversations Mobile App Overview
- Message Lifespan Expiry
- Logging In to the Secure Conversations Mobile App
- Logging Out of the Secure Conversations Mobile App
- Changing Passwords in the Mobile Apps
- Conversations Listing
- Starting Resident Conversations
- Starting General or Cross-Facility Conversations
- Adding Participants
- Photos in Conversations in the Mobile App
- Set as Urgent on the Mobile App
- Creating a Progress Note
- Uploading Photos to the Chart
- Leave and End Conversations from the Mobile App
-
Secure Conversations in the Web
-
Skin & Wound
- Skin & Wound Setup
- Skin & Wound Web Application
-
Skin & Wound Mobile App
- Logging In and Out of the Skin & Wound Mobile App
- Completing Risk Assessments in the Skin & Wound Mobile App
- Capturing Wound Images in the Skin & Wound Mobile App
- Capturing Images with the Skin & Wound Mobile App Quick Reference Guide
- Completing Wound Assessments in the Skin & Wound Mobile App
- Capturing Images when Reassessing Existing Wounds in the Skin & Wound Mobile App Quick Reference Guide
- Tracking Progress and History of Wounds in the Skin & Wound Mobile App
- Therapy Minutes
- Weights and Vitals
- WoundRounds
-
General Clinical Setup
-
Admin
-
Accounts Receivable (Billing) Setup
- Overview of Billing Setup
- Completing the AR Configuration
- Creating AR Groups
- Completing Census Budgeting
- Completing the Chart of Accounts
- Creating Charge and Adjustment Code Categories
- Managing Charge and Adjustment Codes
- Completing Charge Code Amount Setup
- Creating General Note Types
- Managing Payers
- Creating Rate Type Categories
- Creating Rate Types
- Creating Rate Schedules
- A La Carte
- A/R Batches
-
New Cash Receipts for Canada
- Entering Resident Cash Receipt Transactions
- Using Rapid Entry in Cash Receipt Batches
- Entering Miscellaneous Cash Receipt Transactions
- Entering Contact Cash Receipts
- Reversing Entries from Posted Batch
- Applying Payments in the Billing Portal
- Clearing the Subsidy Payer Using Rapid Entry in Cash Receipt Batches
- Setting up Automatic Write Off for Cash Batches Quick Reference Guide
- A/R Profile
- Billing
- Census and Rates
-
Collections
-
Collections Setup
- Collections Security
- Creating Collections Activity Types
- Creating Collections Account Status
- Creating Collections Activity Categories
- Creating Collections User Defined Fields
- Creating Collections Aging Setup
- Creating Collections Groups Set Up
- Creating Collections Letters
- Managing Collections Template Configuration
- Managing Collections Resident Header
-
Collections
- Generating Collection Accounts
- Managing the Collections Account Portal
- Managing Collections Additional Account Information
- Updating Collections Account Status
- Logging Activities for an Outstanding Collections Account
- Reviewing Collections Account History
- Adding General Notes
- Adding Documents
- Managing Collections Upcoming Activities
- Collections Activity Report
- Generating Collections Letters
- Collections Dashboards and Reports
-
Collections Setup
-
Configuration
-
Billing Configuration
- Completing the Chart of Accounts
- Creating Charge and Adjustment Code Categories
- Managing Charge and Adjustment Codes
- Completing Charge Code Amount Setup
- Creating Care Level Templates
- Creating Rate Templates
- Managing and Creating Payers
- Creating Schedules
- Mapping Schedule/Status by Payer
- Creating Payer Rules
- Creating Ancillary Rules
- Managing Payer Rules and Rate Schedules
- Managing Statement Configuration
- Creating A/R Groups
- Managing Transaction Edit Checks
- Organization Setup
-
Billing Configuration
- Documents
-
Document Manager
- Overview of Document Manager
-
Setting Up Document Manager
- Document Manager Security
- Document Manager Setup
- Document Manager Resource
- Troubleshooting for Enabling Macros in Word
- Formatting Word Documents for Document Manager
- Re-downloading a New Field Listing for Document Manager
- Managing Document Manager Templates
- Adding e-Signature to a Document Template
- Creating e-Signature Fields in a Document Template
- Managing In Use Document Manager Templates
- Copying Document Manager Templates
- Versioning a Document Manager Template
- Managing Document Manager Packets
-
Using Document Manager
-
Using Document Manager
- Overview of Document Manager on the Resident Chart
- Selecting Document Manager Packet(s) to Generate from the Resident Chart
- Selecting Document Manager Template(s) to Generate from the Resident Chart
- Reviewing a Document Manager Templates before Generating from the Resident Chart
- Overview of Document Manager Actions from the Resident Chart
- Viewing a Document Manager Document from the Resident Chart
- Printing a Packet of Documents from the Resident Chart
- Deleting a Document Manager Document from the Resident Chart
- Editing Layout to an e-signature Document from the Resident Chart
- Overview of Document Manager Portal
- Redirecting from Document Manager Portal to Document Manager on the Resident Chart
- Printing Document Manager Documents from the Clinical Chart
- Navigating the Document Manager Dashboard
- Adding Signers to an e-Signature Document
- Completing e-Signature Fields in a Generated Document
- Editing Layout of an e-Signature Document from the Resident Chart
- Completing Remote Signing Quick Reference Guide
- Completing Remote Signing
- Viewing Documents from Document Manager Archive
-
Using Document Manager
- Reports
-
Electronic Funds Transfer Setup
- Electronic Funds Transfer Overview
-
EFT Bank Configuration
- EFT Bank and Timing Configuration Overview
- Creating Electronic Funds Transfer (EFT) Bank Configurations
- Editing an EFT Bank Configuration
- Associating Facilities to an EFT Bank Configuration at the Management Console
- Adding and Removing Facilities from an EFT Bank Configuration
- Reviewing EFT Bank Configuration Audit and Facility Audit Reports
- EFT Timing Configurations
- Managing Electronic Funds Transfer (EFT) Export Batch Numbering
-
Electronic Funds Transfer
- EFT Resident Setup
- EFT Resident List Report
- Electronic Funds Transfer (EFT) Quick Reference Guide
- Management Console EFT Cash Receipt Batches
- Management Console Auto Created EFT Cash Receipt Batches
-
Management Console No Schedule EFT Cash Receipt
Batches
- Manually Creating No Schedule EFT Cash Receipt Batches at the Management Console
- Editing EFT Cash Receipt Batches at the Management Console
- Printing EFT Cash Receipt Batches at the Management Console
- Manually Posting EFT Cash Receipt Batches at the Management Console
- Manually Exporting EFT Cash Receipt Batches at the Management Console
- Facility Level Auto Created EFT Cash Receipt Batches
-
Facility Level No Schedule EFT Cash Receipt
Batches
- Manually Creating No Schedule EFT Cash Receipt Batches at the Facility Level
- Editing EFT Cash Receipt Batches at the Facility Level
- Printing EFT Cash Receipt Batches at the Facility Level
- Manually Posting EFT Cash Receipt Batches at the Facility Level
- Reversing EFT Cash Receipt Batches at the Facility Level
- Deleting EFT Cash Receipt Batches at the Facility Level
- Manually Exporting EFT Cash Receipt Batches at the Facility Level
-
Financial Dashboards
- Creating New Dashboard Views
- Creating a Standard Dashboard Layout by Position
-
Financial Dashboards
- Incomplete Census Dashboard Pane
- Empty Locations Dashboard Pane
- New Residents Dashboard Pane
- ADT Revisions Dashboard Pane
- Overdue Waiting List Requests Dashboard Pane
- Clinical Alerts Dashboard Pane
- Inbound ADT Errors Dashboard Pane
- Bed Hold/LOA Days Remaining Dashboard Pane
- Daily Summary Dashboard Pane
- Residents with No Rate Found Dashboard Pane
- Go Live Census
- Go Live Balances Forward
- Leave Tracking
- Market Rates Management
- Month End AR
- Month End Close
-
Reporting
-
ADT Profile Reports
- Action Summary Report
- Cardex Report
- Detailed Census Report
- Length of Stay Report
- Age Summary and Average Age Reports
- Admit/Discharge To/From Report
- Admission Record Report
- Transfer/Discharge Record Report
- Transfer/Discharge Record *NEW* Report
- Resident List Report
- Resident List Report "New"
- Birthday List Report
- Language List Report
- Resident External Facilities Setup Report
- Religion List Report
- Custom Resident Labels Report
- Resident Contacts Report
- Resident Contacts Mailing Labels Report
- Medical Professionals Report
- Medical Professionals Resident Listing Report
- Medical Professionals Mailing Labels Report
- Staff List Report
- Staff Detail Report
- User Defined Information Report
- Facility Common Codes Report
- Online Documentation Storage Report
- General Notes Report
- Assessment Reports
-
Billing Reports
- Bill Groups Report
- Billing Messages Report
- Resident Rates Report
- Resident Rent Roll Report
- Resident Rent Report
- Bed Hold/LOA Days Remaining Report
- Payer Setup Information Report
- Recurring Transactions Report
- GL Account Number History Report
- Transaction Report New
- Transaction History Report
- Payer Billing Log Report
- Print Statements Report
- Statements *New* Report
- Revenue Reconciliation Report
- A/R Aging *New* Report
- A/R Reconciliation Report
- Cash Receipts Journal
- Journal Entries Report
- Management Console Bank Deposit Report
- Revenue Journal Report
- Service Utilization Report
- Point of Care Billing Report
- Letters Reports
- Trust Reports
- Security Reports
-
ADT Profile Reports
- Resident Entry
- Resident Profile & Identifier
- Security
- Statement Billing
- Tax Letters
-
Trust
- Trust Setup
- Trust Profile
-
Trust Portal
- Trust Portal Overview
- Control Accounts
- Current Posting Period/Recurring Batches
-
Trust Batches
-
Overview
- Open Trust Batches Overview
- Creating a Trust Batch
- Editing Trust Batches
- Using Edit all in Trust Batches
- Trust Portal - Open Trust Batches Print
- Trust Portal - Open Trust Batches Post
- Trust Portal - Open Trust Batches Delete
- Trust Portal - Open Trust Batches Copy
- Trust Portal - Open Trust Batches Receipts
-
Overview
- Creating Trust Interest Batches
- Pay Bills From Trust Batches
- Cash Box
- Trust Statements
- Reconciling and Closing Trust
-
Rate Enhanced Billing
-
Configuring Enhanced Rates
- Benefits of New Rate Configuration
- Canadian Rate Transition Quick Reference
- Creating Room Rate Type Categories
- Creating Room Rate Types
- Assigning Room Rate Types in Room Listing
- Mapping Room Rate Type Relationship
- Updating Payer Setup for Rate Enhanced Billing
- Activating Payers
- Creating Care Level Templates
- Creating Schedules
- Mapping Schedule/Status by Payer
- Creating Rate Templates
- Completing Payer Rules
- Managing Payer Rules and Rate Schedules
- Transition to Enhanced Billing
- Reviewing the Enhanced Billing Transition (EBT) Census Entry
- Configuration for Adjustment Batches
- Managing Statement Configuration
-
Using Rate Enhanced Billing
- Using Previous\Current Census Rates
- Using New Fields in Census Entries
- Selecting Additional Location
- Reviewing the Enhanced Billing Transition (EBT) Census Entry
- Using Quick ADT with Enhanced Billing
- Creating Rates for Residents on Subsidy
- Creating Recurring Charges Using Generate Transactions
- Billing Portal
- A La Carte
- Market Rates Management
- Outpatients
- Tax Letters
- Reconciling Month End
- Reports
-
Configuring Enhanced Rates
- The Pulse Quick Reference Guide
-
Accounts Receivable (Billing) Setup
-
General Ledger/Accounts Payable
- GL/AP Configuration
-
Accounts Payable Invoices
- Overview and Accessing Invoices
-
AP Invoice Entry and Recurring Invoices
-
Entering an Invoice Batch
- Invoice Links Overview
- Invoices and Credit Memos Overview
- Creating New Invoice Batch
- Entering Invoices/Credit Memos at the Facility Level
- Reviewing Payable Entries
- Editing Invoice Batch
- Editing Invoice Entries
- Correcting an Entry Type Correction: Invoice vs. Credit Memo
- Deleting Invoice Entries
- Posting Invoice Batch
- Frequently Asked Questions for Invoices
- Recurring Batches
- Accounts Payable Reports
- Expiring Discounts Report
-
Entering an Invoice Batch
- Invoice Filter
- Head Office Invoice Filter
-
AP Payments and Reversals
-
System Payments
- Payments Overview
- Creating a New System Payment Batch
- Adding Invoices to System or Manual Batch
- Editing Payments
- Payments Report
- Deleting Payments
- Generating Payments Printable View
- Printing and Posting GP/AP Payments
- Reprinting Checks
- Generating a Check Copy
- Troubleshooting Common Errors for AP Payments
- Setting up, Processing, and Creating Credit Card Payments
- Setting up and Processing Credit Card Payments Quick Reference Guide
- System Payments Quick Reference Guide
- Reprint
-
Manual Payments
- Creating New Manual Payment Batch
- Adding Invoices to System or Manual Batch
- Creating New Manual Check
- Generating No Vendor Option
- Creating a Misc Payment with No Invoice
- Editing Payments
- Payments Report
- Deleting Payments
- Generating Payments Printable View
- Reprinting Checks
- Generating a Check Copy
- Manual Payments Quick Reference Guide
- Reversals
- Accounts Payable Reports
-
System Payments
- GL Processing and Reports
-
Financial Statements
- Financial Statements Overview
- Creating an Account Group
- Creating a Days/Units Account Group
- Copying and Creating a Summary Account Group
- Custom Reports Overview
- Creating a Report
- Editing Reports to Assign Account Groups and Columns
- Setting the Report Layout
- Analyzing Custom Financial Reports
- Generating a Financial Report
- Creating a Custom Cash Flow Report in GL/AP
- Month End and Bank Reconciliation
- Year End Procedures Overview
-
Customer Relationship Management
- Overview of Customer Relationship Management (CRM)
- CRM Activation
- Security
- CRM Setup
- Organization Setup
- Preferences
-
Customer Relationship Management (CRM) Leads
- Creating a New CRM Lead
- Completing Additional Information for a CRM Lead
- Completing Mandatory Activities
- Creating Contacts for a CRM Lead
- Creating Accounts for a CRM Lead
- Creating Activities for a CRM Lead
- Adding Predefined Activities for a CRM Lead
- Printing Activity Notes for a CRM Lead
- Viewing Lead History for a CRM Lead
- Selecting Possible Placements for a CRM Lead
- Adding/Uploading Misc Documents for a CRM Lead
- Completing Assessments in CRM Lead Details
- Navigating the Lead Listing
- Closing a CRM Lead
- Re-opening a CRM Lead
- Contacts
- Accounts
- Activities
- Availability and Occupancy (A&O)
-
Dashboards and Reports
-
CRM System Dashboards
- Overview of CRM Dashboard
- Conversion Rate by Facility (system) Dashboard
- Activities by Status (system) Dashboard
- Lost/Denied Leads by Facility (system) Dashboard
- Leads by Referral Account (system) Dashboard
- Leads by Sales Cycle (System) Dashboard
- Top Sales Rep (System) Dashboard
- Potential Revenue by Facility (system) Dashboard
-
CRM Reports
- Legacy Reports
- Creating Custom Reports
- Lead Conversion Report
- Tour Conversion Report
- Referrals Analysis By Account Report
- Referrals Analysis by Facility Report
- Referrals by Account Report
- Referrals Status by Account Report
- Lead Status by Owner Report
- Leads by Sales Cycle Report
- Lost Leads by Competitor Report
- Leads by Source Report
-
CRM System Dashboards
- Installing Customer Relationship Management (CRM) Apps on an iOS Device Quick Reference Guide
- Installing Customer Relationship Management (CRM) Apps on an Android Device Quick Reference Guide
- IRM to CRM Migration
-
Using PointClickCare: Videos
- The Basics Videos
-
Clinical Videos
- Allergies Videos
- Care Plan Videos
- EHR Scorecard Videos
- eINTERACT Videos
- eMAR Videos
-
Integrated Medication Management (IMM) Videos
- Integrated Medication Management Overview
- Best Practices for Monitoring: Video
- Messages Overview
- Status Progression Medications
- Reorder or Refill from Pharmacy
- Order Supply Summary
- Order Confirmation
- Supplies On-Order (Electronic)
- Electronically Receiving Supplies
- Order Entry with IMM and Fax Requirements
- Therapeutic Interchange
- Reviewing Orders in the Follow-up Tab
- Updating a Supply Record
- Supplies Returned to Pharmacy
- Residents to be Matched
- Mapping a Resident
- No Match Found Troubleshooting
- Ordered Medication not Delivered Troubleshooting
- Cleaning Up the Orders Portal
- Immunizations Videos
- LTC eConnect Videos
-
MDS 2.0 Videos
- Creating and Copying MDS Assessment
- RUG Optimizer
- Populating Data in the MDS 2.0
- Data Entry and Completing Sections
- Section V - Narrative CAPs/RAPs
- Section V - RAPs Worksheet
- In Progress View (MDS Portal)
- Create Contact Information File
- Create and Export a Batch
- Recording and Revising Recorded Results
- Correct Assessment with Effective Date Prior to April 1, 2012
- Delete Accepted MDS Assessments
- Medical Diagnosis Videos
- Orders Videos
- Point of Care (POC) Videos
- Point of Care (POC) Task Management Videos
- Progress Notes Videos
- Resident Data Videos
- Resident Event Calendar Videos
- Risk Management Videos
- Skin & Wound Videos
- Therapy Minutes Videos
- Weights and Vitals Videos
- Admin Videos
-
General Ledger/Accounts Payable Videos
- AP Reversals Videos
-
Troubleshooting
- AP Clerk
- Accountant
-
Configuration
- How to Set Up Head Office
- How to Add a New Facility to Head Office Configuration
- How to Correct or Change PDF Check Layout
- How to Close Month in GLAP
- How to Create New Fiscal Year
- How to Record Adjusting Entry to Closed Year
- How to Create Account Groups Subgroups and Assign Account Numbers
- How to Complete Bank Reconciliation
- Troubleshooting
- Release Newsletters
- Other Documents
PrevNext
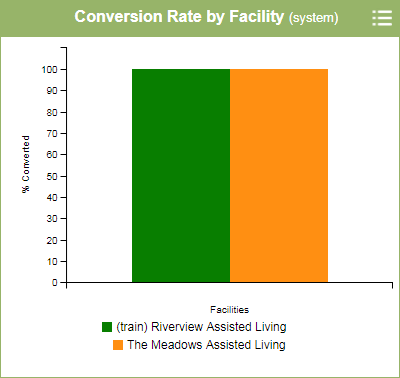
To view a summary of conversion rate for the month, use the CRM Dashboard Conversion Rate by Facility (system) graph. Conversion Rate by Facility shows the percent converted (won), out of total leads (lost and denied) with a lead date.
The graph shows data grouped by facility of possible placements. Facilities show along the bottom and percent converted shows along the left side.
-
View the Conversion Rate by Facility (system) graph.
-
You can analyze all data or focus one Facility by hovering over one Facility name at a time. Hovering highlights the bar for that Facility.