-
PointClickCare: The Basics
- PointClickCare: The Basics
- Signing In and Signing Out of PointClickCare
- Internet Security with the PointClickCare Platform
- Logging a Support Case
- Changing Your Password
- Bulletin Board
- Communications Message Board for Care Staff
- Reviewing PointClickCare Announcements
- Using the PointClickCare Help Center
- Configurable Terminology in PointClickCare
- Installing MeadCo Script for Printing using Internet Explorer (IE) Quick Reference Guide
- Managing Pop Up Blockers
-
Clinical
-
General Clinical Setup
- Completing General Configuration
- Security for General Setup
- Managing Scoping
- Reviewing Admin General Configuration
- Reviewing Facility Configuration
- Reviewing Resident Identifiers
- Reviewing User Defined Fields
- Reviewing Pick Lists
- Reviewing Department/Position
- Reviewing Security Users
- Enabling Customer Specific Quick Link
- Reviewing the Strike Out Pick List
- Managing General Note Types
- Setting Up MPI Clinical Documentation (Historical Records)
- Setting Up Online Documentation Storage
- Managing Dashboard Layouts
-
Resident Information
- Admissions, Discharges, Transfers, and Room Changes
- Resident Information
- Profile Module Overview
- Resident Data - Physician Visits
- Scanning and Uploading Documents to the Resident Record
-
Dashboards and Reports
-
Dashboards
- Clinical Dashboard Overview
- Resident Dashboard Overview
- Editing the Dashboard Layout
- Create a New Dashboard Layout
- Identifying Incomplete Admission
- Overdue Waiting List Requests Dashboard Pane
- Daily Summary Dashboard Pane
- ADT Incomplete Census from the Clinical Dashboard
- ADT Dashboard Pane
- Resident Dashboard Census Summary
- Resident Photo Dashboard Pane
-
Reports
- Clinical Reports Overview
- Printing Reports
- Admit/Discharge To/From Report
- Action Summary Report
- Birthday List Report
- Resident List Report *New*
- Custom Resident Labels Report
- Language List Report
- Religion List Report
- Resident Contacts Report
- Resident Contacts Mailing Labels Report
- User Defined Information Report
- Transfer/Discharge Record Report
- Admission Record Report
- Transfer/Discharge Record *NEW* Report
- Transfer/Discharge Record (blank) *NEW* Report
- Online Documentation Storage Report
- Re-hospitalization (non-eINTERACT) Report
-
Dashboards
- Allergies
-
Analytics
- Analytics Setup
-
Analytics
-
Quality Indicators
- Quality Indicators Overview and Access
- Adding Custom Benchmarks and Settings
- Overview of Analytics Dashboards
- Interpreting the Corporate QI Dashboard
- Interpreting the Facility QI Dashboard
- Interpreting the Resident QI Dashboard
- Interpreting the QI Score Trend Dashboard
- Interpreting the QI Compare Dashboard
- Managing Quality Improvement Project
-
Clinical Key Performance Indicators
- CKPI Overview and Access
- Overview of CKPI Dashboards
- Adding Custom Benchmarks
- Interpreting the Corporate CKPI Dashboard
- Interpreting the Facility CKPI Dashboard
- Interpreting the Resident CKPI Dashboard
- Interpreting the Resident Characteristic CKPI Dashboard
- Interpreting the CKPI Trend Dashboard
- Interpreting the CKPI Compare Dashboard
-
Readmissions
- Overview and Accessing Readmissions Analysis
- Resident Stay Record
- Understanding Readmissions Analysis Calculations
- Setting Readmission Benchmarks
- Interpreting the Corporate Summary Dashboard
- Interpreting the Corporate Rate Detail Dashboard
- Interpreting the Corporate Average Length of Stay Dashboard
- Interpreting the Facility Dashboard
- Interpreting the Facility Average Length of Stay Dashboard
- Interpreting the Resident Listing Dashboard
- Interpreting the Average Length of Stay Resident Listing Dashboard
-
Quality Indicators
-
Assessments
-
Assessments Setup
- Overview of Assessments
- Security for Assessments
- Navigating the Custom Assessment Library
- Creating New Custom Assessments
- Adding Rules, Triggers, Style, and Lookbacks to Custom Assessments
- Creating Structured Progress Notes for Assessments
- Scoring and Setting Schedules for Assessments
- Adding Dependencies to Assessments
- Versioning and Copying Assessments
- Template Assessments for Long-Term Care
-
Assessments
- Navigating the Assmnts Tab Quick Reference Guide
- Creating Assessments
- Managing Acknowledgements, Errors, and Warnings
- Signing and Locking Assessments
- Section Status and Colour Coding in Assessments Quick Reference Guide
- Symbols in Assessments Quick Reference Guide
- Standard Question Types in Assessments Quick Reference Guide
- Assessments Reports
- Assessments Management
-
Assessments Setup
-
Care Plans
-
Care Plans Setup
- Overview of Care Plans
- Reviewing Admin and Clinical Setup for Care Plans
- Managing Terminology Configuration
- Managing Care Plan Configuration
- Managing Care Plan Library Items
- Creating Reasons for Care Plan Closure
- Creating Care Plan Types
- Managing Kardex
- Creating Standard Shifts
- Creating Standard Documentation Frequencies
- Managing Care Record Types
- Care Plans
- Care Plan Reviews
-
Care Plans Setup
-
Census for Clinical
- Census for Clinical Only - Update Census Entries Overview
- Census for Clinical - Updating Incomplete Census
- Census for Clinical Only – Delete Census Entry
- Census for Clinical Only – New Census Entry
- Viewing Empty Beds
- Creating New Resident
- Viewing ADT Revisions
- Viewing Beds with Multiple Occupants
- Action Summary Report
- Detailed Monthly Census Report
- Clinical Chart
-
Dashboards
- Active Allergies Dashboard Pane
- Active Diagnoses Dashboard Pane
- Activities of Daily Living Dashboard Pane
- Administered PRN Medication Audit Dashboard Pane
- ADT Dashboard Pane
- Advance Directive Dashboard Pane
- All Conversations Dashboard Pane
- Blood Pressure Graph Dashboard Pane
- Care Plan Goals Overdue/Due Dashboard Pane
- Care Plan Reviews Overdue/Due Dashboard Pane
- Clinical Alerts Dashboard Pane
- Current CMI (MDS 2.0) Dashboard Pane
- Daily Summary Dashboard Pane
- Diagnosis Notification Dashboard Pane
- Diet Dashboard Pane
- Event Calendar Worklist Dashboard Pane
- General Notes Dashboard Pane
- High Priority Progress Notes Dashboard Pane
- Immunization Issues Dashboard Pane
- Incomplete Care Plans Dashboard Pane
- Incomplete Census Dashboard Pane
- MDS Scores (MDS 2.0) Dashboard Pane
- Med Passes in the Last 24 hours Dashboard Pane
- Medications Dashboard Pane
- Most Recent Vitals Dashboard Pane
- Number of Active and On Hold Medication Schedules for Each Resident Dashboard Pane
- Order Alerts Dashboard Pane
- Orders on Hold > 30 Days or Requiring Reassessment Dashboard Pane
- Orders Pending Signature Dashboard Pane
- Orders Review Dashboard Pane
- Overdue Waiting List Requests Dashboard Pane
- Physician Visits Dashboard Pane
- POC Assignment Status Dashboard Pane
- POC Unscheduled Task Alerts Dashboard Pane
- Proceed to Care Plan RAPs/CAPs Dashboard Pane
- Progress Notes in Last 30 Days Dashboard Pane
- Quality Indicators and Quality Measures (MDS 2.0) Dashboard Pane
- Resident Photo Dashboard Pane
- Scheduled Events Dashboard Pane
- Therapy Minutes Summary Dashboard Pane
- UDA Scores Dashboard Pane
- Undocumented PRN Orders > 30 Days Dashboard Pane
- Unreviewed Laboratory Results Dashboard Pane
- Unreviewed Radiology Results Dashboard Pane
-
EHR Scorecard
- EHR Scorecard Setup
-
Using EHR Scorecard
- Overview of EHR Scorecard
- Stage 1 – ADT
- Stage 1 – Allergies
- Stage 1 – Transaction Processing
- Stage 1 – Diagnosis
- Stage 1 – MDS
- Stage 2 – Care Plans
- Stage 2 – Basic Assessments
- Stage 2 – Weights and Vitals
- Stage 3 – Point of Care Documentation
- Stage 4 – Order Management
- Stage 4 – Progress Notes
- Stage 5 – Orders Integration
- Percentile Report
- Absolute Values Report
- eINTERACT
-
eMAR
- eMAR Setup
-
eMAR
- Logging In and Out of eMAR
- Navigating the eMAR Quick Reference Guide
- Navigating the Resident's Chart in eMAR Quick Reference Guide
- Navigating the Administrations in eMAR Quick Reference Guide
- Color Coding and Symbols in eMAR Quick Reference Guide
- Using Advanced Filters in eMAR
- Documenting Scheduled Orders in eMAR
- Setting Reminders in eMAR
- Apply Chart Code to All Administrations
- Documenting PRN Orders in eMAR
- Documenting Follow Up for PRNs in eMAR
- Striking Out Documentation in eMAR
- eMAR Reports and Dashboards
- eMAR Order Supply Management
- Hospital Tracking Portal
- Immunizations
- LTC eConnect
-
MDS 2.0
-
MDS 2.0 Setup
- Overview of MDS 2.0
- Security for MDS 2.0
- Reviewing Admin and Clinical Setup for MDS 2.0
- Completing MDS 2.0 Configuration
- Completing MDS Configuration
- Managing MDS 2.0 Triggers, Warnings and Look Backs
- Completing Integrated Assessment Record (IAR) Configuration
- Overview of Therapy Minutes
- Security for Therapy Minutes
-
MDS 2.0
-
MDS Data Entry
- Overview of MDS 2.0
- MDS 2.0 Tab Overview
- Creating New MDS 2.0 Assessment
- Copying an MDS 2.0 Assessment
- MDS 2.0 RUG Optimizer
- MDS 2.0 Section Listing
- MDS 2.0 Review of Sections
- Colour Coding in MDS 2.0
- MDS 2.0 - Symbols Legend
- MDS 2.0 Data Autopopulation and Auto Validation of Questions
- MDS 2.0 Refresh Data
- Opening the RAI-MDS 2.0 Manual
- MDS 2.0 Question Types Overview
- MDS 2.0 Errors and Warnings
- Completing MDS 2.0 Sections
- MDS 2.0 Portal - In Progress View
- MDS 2.0 - Section V
- Locking the MDS 2.0 Assessment
- Printing MDS 2.0
- Overview of Submissions
- MDS 2.0 Batches Portal
- MDS 2.0 - Submissions - Create a Contact Information File
- MDS 2.0 - Submissions - Create a Batch
- MDS 2.0 Portal Overview
- MDS 2.0 Scheduler
- MDS 2.0 Case Mix Analyzer
- Closing an MDS 2.0 Assessment
- MDS 2.0 - Strike Out an MDS Assessment
- MDS 2.0 Kardex
- RAPs/CAPs
-
MDS Submissions
- Overview of Submissions
- MDS 2.0 Batches Portal
- MDS 2.0 - Submissions - Create a Contact Information File
- MDS 2.0 - Submissions - Create a Batch
- MDS 2.0 - Submissions - Export a Batch
- Record Results for Batch Submissions
- MDS 2.0 - Submissions - Revise Recorded Results
- MDS 2.0 - Submissions - Correcting Accepted Assessments
- MDS 2.0 - Submissions - Correct an Assessment with Effective Date Prior to April 1, 2012
- Deleting Accepted Assessments
- MDS 2.0 - Submissions - Health Record Number (A6a) Troubleshooting
- MDS 2.0 - Submissions - Admission Date (AB1) Troubleshooting
-
Monitoring and Managing
- Monitoring and Managing
-
Reports and
Dashboards
- MDS 2.0 - Resident Dashboard - Clinical Alerts
- MDS 2.0 - Resident Dashboard - Activities of Daily Living
- MDS Scores (MDS 2.0) Dashboard Pane
- MDS 2.0 Resident Dashboard Scheduled Events
- MDS 2.0 - Clinical Dashboard - Clinical Alerts
- Integrated Assessment Record (IAR) – Entering Consent – MDS Tab
- Integrated Assessment Record (IAR) – Entering Consent – MDS Assessment
- Proceed to Care Plan RAPs/CAPs Dashboard Pane
- Current CMI (MDS 2.0) Dashboard Pane
- Quality Indicators and Quality Measures (MDS 2.0) Dashboard Pane
- MDS 2.0 - Resident Dashboard - New Quality Indicators and Quality Measures
- Assessment History Report
- Assessment Scoring Report
- Assessment Warnings Report
- Case Mix Detail Report
- Resident Response Analyzer Report
- Resident Response List Report
- Resident Response Comparison Report
- MDS 2.0 Kardex Report
- MDS 2.0 Clinical Summary Report
- MDS QI Report/MDS QI Report V2.0
- MDS 2.0 QI Extract Report
- MDS 2.0 RAPs Summary Report
- RAPs Quarterly Summary Report
- RUGs Summary Report
- RUG Weighted Patient Days (RWPD) Report
- MDS 2.0 Quality Indicator Quarterly Comparison Report
- Look Back Report
- Missing Entries for Assessments Report
- MDS 2.0 Enterprise Reports - Quality Indicator Corporate Comparison Report
-
MDS Data Entry
-
MDS 2.0 Setup
- MDS Analytics
-
Medical Diagnosis
- Medical Diagnosis Setup
-
Medical Diagnosis
- Medical Diagnosis Overview
- Adding a Medical Diagnosis
- Medical Diagnosis - Update or Resolve Existing Diagnosis
- Strike out a Diagnosis
- Filtering and Sorting Medical Diagnosis
- Medical Diagnosis - Rank and Classification Overview
- Medical Diagnosis Notifications Overview
- Managing Diagnosis Notifications
- Diagnosis Notification Dashboard Pane
- Medical Diagnosis Audit Report
- Active Diagnoses Dashboard Pane
- Medical Diagnosis Report *New*
- Medical Diagnosis Report
- Medical Diagnosis - Missing Entries Report
-
Nutrition Management
- Nutrition Management Setup
- Nutrition Management
- Residents
-
Menus
- Overview of Menus
- Navigating the Menu Entry Screen
- Menu Builder
- Order Manager
- Meal Orders
- Meal Order Screen
- Ticket Dashboard
- Production
-
Reports
-
Residents Reports
- Resident Listing Report
- On Hold Listing Report
- Birthday Report
- Diet Order Tally Report
- Diet Order Conflict Report
- Unique Diet Order Combination Report
- Residents with No Texture Report
- Residents with No Special Diet Report
- Resident Summary Report
- Resident Details Report
- Meal Distribution Report
- Tray Cards Report
- Dislike Tally Report
- Adaptive Equipment Tally Report
- Dining Location Assignment Report
- Resident Alert Tally Report
- Menu Type Listing Report
- Selective Menus Report
- Diet Order Changes Report
- Standing Order Labels Report
- Standing Order Lists Report
- Standing Order Tally Report
- Menu Reports
-
Production Reports
- Ingredient Listing Report
- Ingredient/Recipe Find Report
- Ingredient Usage Report
- Recipe Listing Report
- Pre-Purchased Recipe Listing Report
- Menu Item - Recipe Links Report
- Recipe Not Required Report
- Multi–Recipe Printing Report
- Multi-Serve Recipe Printing Report
- Recipe Books Report
- Production Notes Report
-
Residents Reports
- Administrator Reports
-
Orders Management
-
Orders Setup
-
Orders Setup
- Security for Orders Management
- Reviewing Admin and Clinical Setup for Orders Management
- Security Role Based Alerts Configuration
- Completing Orders Configuration
- Creating Standard Shifts
- Managing Standard Time Codes
- Managing Custom Medications
- Managing Orders Pick Lists
- Importing Order Templates
- Managing Order Templates and Sets
- Setting Up Formularies
- Setting Up Advanced Formulary Management
-
Setting Up
Electronic Signatures for Orders in the Web
- Setting Up Electronic Signatures for Orders in the Web Quick Reference Guide
- Viewing Electronic Signature Configuration
- Linking Medical Professionals to Security Users
- Reviewing Order Review Dates for Electronic Signature
- Security for Electronic Signatures for Orders in the Web
- Enabling Orders Pending Signature
- Managing Device Tokens for Users
- Setting Up Clinical Order Review
- Creating and Managing Pharmacies and Other External Facilities
-
Orders Setup
-
Orders
- Order Entry
- Managing Orders
- Electronic Order Signature and Order Reviews for Practitioners
- Monitoring Order Signatures and Order Reviews
-
Dashboards and Reports
- Dashboards
-
Reports
- Administration Record Report
- Diet Type Report
- Drug Record Book Report
- Formulary Item Listing Report
- Ontario Lab Report
- Lab and Diagnostic Record Report
- Medication Review Report
- Order Listing Report
- Order Recap Report
- Order Review History Report
- Order Summary Report
- Pharmacy Admission Report
- Pharmacy Discharge Report
- Pharmacy Requisition Report
- Printed Prescriptions Report
- Printed Prescription for Wet Signature Report
- Order Review Report
- PRN Sheets Report
- Telephone/Verbal Order Form Report
- Telephone/Verbal Order Signature Details Report
- Side Effect Care Records Report
- Resident Medication Count Report
-
Integrated Medication Management (IMM)
- Introduction to Integrated Medication Management
-
Order Management
with IMM
- Managing Clean up of Pharmacy Orders (IMM): Video
- Managing Clean Up of Pharmacy Orders for Integrated Medication Management Quick Reference Guide
- Best Practices for Monitoring: Video
- Monitoring Pharmacy Orders for Integrated Medication Management Quick Reference Guide
- Requesting Reorder
- Confirming Orders
- Confirming Orders Quick Reference Guide
- Medications/Supplies Returned to Pharmacy
- Reviewing Orders in the Follow-up Tab
- Therapeutic Interchange
- Pharmacy Orders that must be Faxed to Pharmacy
- Pharmacy Orders that must be Faxed to Pharmacy Quick Reference Guide
-
Managing
Pharmacy Initiated Orders
- Overview of Pharmacy Initiated Orders
- Managing Pharmacy Initiated Orders
- Reviewing and Confirming Pharmacy Initiated Orders Quick Reference Guide
- Holding Orders
- Resuming Orders
- Creating STAT Pharmacy Initiated Orders
- Creating Off Hours Pharmacy Initiated Orders
- Monitoring Pharmacy Category Orders for Pharmacy Initiated Orders Quick Reference Guide
-
Scanning and
Receiving with IMM
- Waiting to be Received Overview
- Electronically Receiving Overview
- On Order (ELECTRONIC) Overview
- Electronically Receiving Orders
- Manually Receiving Orders with On Order (Electronic) status
- Auto-Receiving Orders
- Receiving Supply Messages (without Scanner) Quick Reference Guide
- Receiving Supply Messages (Electronically) Quick Reference Guide
- Matching Residents and Linking Orders with IMM
- Troubleshooting
-
Orders Setup
-
Paper ADL Documentation
- Paper ADL Docmentation Setup
-
Paper ADL Documentation
- Overview of Paper ADL Documentation
- TASKS (PAPER) - Add Tasks to the Care Record for Documentation
- TASKS (PAPER) - Personalize tasks
- TASKS (PAPER) - Add Tasks/Interventions from the Care Plan
- TASKS (PAPER) - Delete a Task
- TASKS (PAPER) - Resolve or Cancel a Task
- TASKS (PAPER) - Add Tasks Previously Resolved/Cancelled
- TASKS (PAPER), Custom Tasks - Overview of Custom Tasks
- TASKS (PAPER) Creating a Custom Task
- TASKS (PAPER) - Link Progress Note
- TASKS (PAPER) - Icons and Abbreviations
- TASKS (PAPER) - Produce a Task Care Record
- Intervention/Task Schedule Report
-
Point of Care (POC)
-
Point of Care (POC) Setup
- Overview of Point of Care (POC)
- Security for POC
- Reviewing Admin and Clinical Setup for POC
- Assigning Passwords in POC
- Assigning Initials and Department/Position
- Completing Task Configuration
- Creating Standard Shifts
- Completing POC General Configuration
- Setting up Care Plans in POC
- Creating Standard Documentation Frequencies
- Managing Icons, Tasks and Care Plan Items in POC
- Managing POC Alerts
- Managing POC Follow Up Questions
- Managing Kardex
- Managing Standard Assignments Groups and POC Assignments
- Managing Care Record Types
- Managing MDS Look Backs
- Managing Look Back Report Setup
- Managing POC Kiosks
- Enabling Task Manager
- Setting Up POC Service Time Tracking
-
Point of Care (POC)
- Logging In and Out of the Point of Care (POC) Mobile App
- Navigating Point of Care (POC) Mobile Quick Reference Guide
- Logging In and Out of the Point of Care (POC) Kiosk
- Navigating the Point of Care (POC) Home Tab Quick Reference Guide
- Navigating the Point of Care (POC) Shift Dashboard Tab Quick Reference Guide
- Colour Coding in Point of Care (POC) Quick Reference Guide
- Navigating the Point of Care (POC) Tab Quick Reference Guide
- Navigating the Point of Care (POC) Resident Care Record Quick Reference Guide
- Understanding Frequencies in Point of Care (POC) Quick Reference Guide
- Documenting Through the Resident Care Record in Point of Care (POC)
- Documenting Resident Not Available For All Tasks in Point of Care (POC)
- Creating Alerts in Point of Care (POC)
- Documenting Through Quick Entry in Point of Care (POC)
- Documenting Unscheduled Tasks in Point of Care (POC)
- Point of Care (POC) Reports
-
Point of Care (POC) Task Management
- Overview of POC Task Management
- Icons and Abbreviations on the POC Task Tab
- Add New POC Tasks from Task Library
- Personalizing POC Tasks
- Change Task Frequency in POC
- Modify Task Schedule in POC
- Delete a Task in POC
- Resolve or Cancel a Task for a Resident in POC
- Resolve a Task for All Residents in POC
- Adding POC Tasks Previously Resolved/Cancelled
- POC Review Unscheduled Task
- Documentation of Restorative Interventions from the Care Plan in POC
- Overview of Custom Tasks in POC
- Creating a Custom POC Custom Task
- Link a Progress Note to a Task in POC
- Link POC Care Plan Focus to a Task
- Census and POC
- System Generated/Cancelled Tasks Quick Reference Guide
- Task Manager
- Dashboards
-
Reports
- Task Care Record Report
- Kardex Report
- Intervention/Task Schedule Report
- Task List Report
- Assignment Location List Report
- Audit Report
- Follow Up Question Report
- Documentation Survey Report V2
- Look Back Report
- Nutrition Report (Advanced Report)
- Priority Report (Advanced Report)
- Response Rate Report
- Signature List Report (POC)
- Trigger Summary Report (Advanced Report)
- Behavior Report (Advanced Report)
- Alert Listing Report
- POC Documentation Compliance Report
- Task Library Report
- Service Schedule Report
- Actual vs. Planned Service Time Utilization by Resident Report
- Actual vs. Planned Service Time Utilization by Shift Report
- Actual vs. Planned Service Time Utilization by Task for a Resident Report
- Planned Service Time Utilization Report
- Planned Service Time Utilization by Task and Shift
-
Point of Care (POC) Setup
- Progress Notes
-
Reporting
- 24hr Summary Report
- Action Summary Report
- Actual vs. Planned Service Time Utilization by Resident Report
- Actual vs. Planned Service Time Utilization by Shift Report
- Actual vs. Planned Service Time Utilization by Task for a Resident Report
- Administration Record Report
- Admission Record Report
- Alert Listing Report
- Admit/Discharge To/From Report
- Allergy Audit Report
- Allergy/Reaction Library Report
- Allergy Report
- Assessment History Report
- Assessment Report
- Assessment Schedule Audit Report
- Assessment Schedule Cancellation Report
- Assessment Scheduling Report
- Assessment Scoring Report
- Assessment Warnings Report
- Assignment Location List Report
- Behavior Care Records Report
- Behavior Report (Advanced Report)
- Birthday List Report
- Care Record Report
- Care Plan Report
- Focus Summary Report
- Care Plan Item/Task Listing Report
- Care Plan Library Report
- Care Plan Reviews Due Report
- Case Mix Detail Report
- Change Log Report
- Current Weights and Vitals Report
- Custom Resident Labels Report
- Detailed Census Report
- Diet Type Report
- Documentation Survey Report V2
- Drug Record Book *New* Report
- Electronic Transmission Report
- Event Calendar Comparison Report
- Event Calendar Report
- Follow Up Question Report
- Formulary Item Listing Report
- General Notes Report
- Generated History Report
- Generating a Clinical Chart
- Immunization Audit Report
- Immunization Report
- Incident Analysis Report
- Incident Audit Report
- Intervention/Task Schedule Report
- Kardex Report
- Lab and Diagnostic Record Report
- Lab Results Report
- Language List Report
- Location of Administration Report
- MD/Nursing Communications Report
- MDS 2.0 Clinical Summary Report
- MDS 2.0 Kardex Report
- MDS 2.0 RAPs Summary Report
- MDS QI Report/MDS QI Report V2.0
- Medical Diagnosis Audit Report
- Medical Diagnosis Report
- Medical Diagnosis Report *New*
- Medical Professionals Mailing Labels Report
- Medical Professionals Resident Listing Report
- Medication Admin Audit Report
- Medication Review Report
- Midnight Census Report
- Midnight Census Report *New*
- Missing Entries for Assessments Report
- Monthly Weight Report
- Mood and Behaviour Report
- Nutrition Report (Advanced Report)
- Online Documentation Storage Report
- Ontario Lab Report
- Order Audit Report
- Order Listing Report
- Order Recap Report
- Order Review Report
- Order Review History Report
- Order Summary Report
- Pharmacy Admission Report
- Pharmacy Discharge Report
- Pharmacy Requisition Report
- POC Documentation Compliance Report
- Printed Prescriptions Report
- Priority Report (Advanced Report)
- PRN Sheets Report
- Progress Notes Report
- Progress Notes Report *New*
- Radiology Results Report
- Religion List Report
- Resident Contacts Mailing Labels Report
- Resident Contacts Report
- Resident List Report
- Resident List Report *New*
- Resident Response Analyzer Report
- Resident Response Comparison Report
- Response Rate Report
- RUG Weighted Patient Days (RWPD) Report
- RUGs Summary Report
- Service Schedule Report
- Shift Report
- Side Effect Care Records Report
- Signature List Report (Orders)
- Signature List Report (POC)
- Task Care Record Report
- Task Library Report
- Telephone/Verbal Order Form Report
- Telephone/Verbal Order Signature Details Report
- Therapy Minutes Report
- Therapy Minutes Report *New*
- Transfer/Discharge Record *NEW* Report
- Transfer/Discharge Record Report
- Trigger Summary Report (Advanced Report)
- User Defined Information Report
- Weight Calculations Range Report
- Weight Summary Report
- Weights and Vitals Exception Report
- Weights and Vitals Summary Report
-
Resident Event Calendar
- Resident Event Calendar Setup
-
Resident Event Calendar
- Resident Event Calendar Overview
- Resident Event Calendar – Access
- Resident Event Calendar – Navigation Items
- Creating a New Event in the Resident Event Calendar
- Cancelling Events on the Resident Event Calendar
- Edit Resident Event Calendar
- Resident Event Calendar – Marking Attendance and Progress Notes
- Results
- Risk Management
-
Secure Conversations
- Secure Conversations Setup
-
Secure Conversations
-
Secure Conversations in the Web
- Secure Conversations Overview
- Message Lifespan Expiry
- Conversation Types Overview
- Home - My Conversations
- Quick Link - Message Bubble
- Resident-centric Conversations - Resident Header
- All Conversations Dashboard Pane
- New Resident-centric Conversation
- Receiving Conversations and Messages
- Photos Overview
- Creating a Progress Note from Resident-centric Conversations
- Upload Photos to Resident-centric Conversations
- New General Conversations
- New Cross-Facility Conversations
- Leave Conversation
- Ending a Conversation
- Set Urgency
- Unavailable Message
- Notifications in the Mobile App
- TigerText App on Mobile Devices
-
Secure Conversations Mobile
- Secure Conversations Mobile App Overview
- Message Lifespan Expiry
- Logging In to the Secure Conversations Mobile App
- Logging Out of the Secure Conversations Mobile App
- Changing Passwords in the Mobile Apps
- Conversations Listing
- Starting Resident Conversations
- Starting General or Cross-Facility Conversations
- Adding Participants
- Photos in Conversations in the Mobile App
- Set as Urgent on the Mobile App
- Creating a Progress Note
- Uploading Photos to the Chart
- Leave and End Conversations from the Mobile App
-
Secure Conversations in the Web
-
Skin & Wound
- Skin & Wound Setup
- Skin & Wound Web Application
-
Skin & Wound Mobile App
- Logging In and Out of the Skin & Wound Mobile App
- Completing Risk Assessments in the Skin & Wound Mobile App
- Capturing Wound Images in the Skin & Wound Mobile App
- Capturing Images with the Skin & Wound Mobile App Quick Reference Guide
- Completing Wound Assessments in the Skin & Wound Mobile App
- Capturing Images when Reassessing Existing Wounds in the Skin & Wound Mobile App Quick Reference Guide
- Tracking Progress and History of Wounds in the Skin & Wound Mobile App
- Therapy Minutes
- Weights and Vitals
- WoundRounds
-
General Clinical Setup
-
Admin
-
Accounts Receivable (Billing) Setup
- Overview of Billing Setup
- Completing the AR Configuration
- Creating AR Groups
- Completing Census Budgeting
- Completing the Chart of Accounts
- Creating Charge and Adjustment Code Categories
- Managing Charge and Adjustment Codes
- Completing Charge Code Amount Setup
- Creating General Note Types
- Managing Payers
- Creating Rate Type Categories
- Creating Rate Types
- Creating Rate Schedules
- A La Carte
- A/R Batches
-
New Cash Receipts for Canada
- Entering Resident Cash Receipt Transactions
- Using Rapid Entry in Cash Receipt Batches
- Entering Miscellaneous Cash Receipt Transactions
- Entering Contact Cash Receipts
- Reversing Entries from Posted Batch
- Applying Payments in the Billing Portal
- Clearing the Subsidy Payer Using Rapid Entry in Cash Receipt Batches
- Setting up Automatic Write Off for Cash Batches Quick Reference Guide
- A/R Profile
- Billing
- Census and Rates
-
Collections
-
Collections Setup
- Collections Security
- Creating Collections Activity Types
- Creating Collections Account Status
- Creating Collections Activity Categories
- Creating Collections User Defined Fields
- Creating Collections Aging Setup
- Creating Collections Groups Set Up
- Creating Collections Letters
- Managing Collections Template Configuration
- Managing Collections Resident Header
-
Collections
- Generating Collection Accounts
- Managing the Collections Account Portal
- Managing Collections Additional Account Information
- Updating Collections Account Status
- Logging Activities for an Outstanding Collections Account
- Reviewing Collections Account History
- Adding General Notes
- Adding Documents
- Managing Collections Upcoming Activities
- Collections Activity Report
- Generating Collections Letters
- Collections Dashboards and Reports
-
Collections Setup
-
Configuration
-
Billing Configuration
- Completing the Chart of Accounts
- Creating Charge and Adjustment Code Categories
- Managing Charge and Adjustment Codes
- Completing Charge Code Amount Setup
- Creating Care Level Templates
- Creating Rate Templates
- Managing and Creating Payers
- Creating Schedules
- Mapping Schedule/Status by Payer
- Creating Payer Rules
- Creating Ancillary Rules
- Managing Payer Rules and Rate Schedules
- Managing Statement Configuration
- Creating A/R Groups
- Managing Transaction Edit Checks
- Organization Setup
-
Billing Configuration
- Documents
-
Document Manager
- Overview of Document Manager
-
Setting Up Document Manager
- Document Manager Security
- Document Manager Setup
- Document Manager Resource
- Troubleshooting for Enabling Macros in Word
- Formatting Word Documents for Document Manager
- Re-downloading a New Field Listing for Document Manager
- Managing Document Manager Templates
- Adding e-Signature to a Document Template
- Creating e-Signature Fields in a Document Template
- Managing In Use Document Manager Templates
- Copying Document Manager Templates
- Versioning a Document Manager Template
- Managing Document Manager Packets
-
Using Document Manager
-
Using Document Manager
- Overview of Document Manager on the Resident Chart
- Selecting Document Manager Packet(s) to Generate from the Resident Chart
- Selecting Document Manager Template(s) to Generate from the Resident Chart
- Reviewing a Document Manager Templates before Generating from the Resident Chart
- Overview of Document Manager Actions from the Resident Chart
- Viewing a Document Manager Document from the Resident Chart
- Printing a Packet of Documents from the Resident Chart
- Deleting a Document Manager Document from the Resident Chart
- Editing Layout to an e-signature Document from the Resident Chart
- Overview of Document Manager Portal
- Redirecting from Document Manager Portal to Document Manager on the Resident Chart
- Printing Document Manager Documents from the Clinical Chart
- Navigating the Document Manager Dashboard
- Adding Signers to an e-Signature Document
- Completing e-Signature Fields in a Generated Document
- Editing Layout of an e-Signature Document from the Resident Chart
- Completing Remote Signing Quick Reference Guide
- Completing Remote Signing
- Viewing Documents from Document Manager Archive
-
Using Document Manager
- Reports
-
Electronic Funds Transfer Setup
- Electronic Funds Transfer Overview
-
EFT Bank Configuration
- EFT Bank and Timing Configuration Overview
- Creating Electronic Funds Transfer (EFT) Bank Configurations
- Editing an EFT Bank Configuration
- Associating Facilities to an EFT Bank Configuration at the Management Console
- Adding and Removing Facilities from an EFT Bank Configuration
- Reviewing EFT Bank Configuration Audit and Facility Audit Reports
- EFT Timing Configurations
- Managing Electronic Funds Transfer (EFT) Export Batch Numbering
-
Electronic Funds Transfer
- EFT Resident Setup
- EFT Resident List Report
- Electronic Funds Transfer (EFT) Quick Reference Guide
- Management Console EFT Cash Receipt Batches
- Management Console Auto Created EFT Cash Receipt Batches
-
Management Console No Schedule EFT Cash Receipt
Batches
- Manually Creating No Schedule EFT Cash Receipt Batches at the Management Console
- Editing EFT Cash Receipt Batches at the Management Console
- Printing EFT Cash Receipt Batches at the Management Console
- Manually Posting EFT Cash Receipt Batches at the Management Console
- Manually Exporting EFT Cash Receipt Batches at the Management Console
- Facility Level Auto Created EFT Cash Receipt Batches
-
Facility Level No Schedule EFT Cash Receipt
Batches
- Manually Creating No Schedule EFT Cash Receipt Batches at the Facility Level
- Editing EFT Cash Receipt Batches at the Facility Level
- Printing EFT Cash Receipt Batches at the Facility Level
- Manually Posting EFT Cash Receipt Batches at the Facility Level
- Reversing EFT Cash Receipt Batches at the Facility Level
- Deleting EFT Cash Receipt Batches at the Facility Level
- Manually Exporting EFT Cash Receipt Batches at the Facility Level
-
Financial Dashboards
- Creating New Dashboard Views
- Creating a Standard Dashboard Layout by Position
-
Financial Dashboards
- Incomplete Census Dashboard Pane
- Empty Locations Dashboard Pane
- New Residents Dashboard Pane
- ADT Revisions Dashboard Pane
- Overdue Waiting List Requests Dashboard Pane
- Clinical Alerts Dashboard Pane
- Inbound ADT Errors Dashboard Pane
- Bed Hold/LOA Days Remaining Dashboard Pane
- Daily Summary Dashboard Pane
- Residents with No Rate Found Dashboard Pane
- Go Live Census
- Go Live Balances Forward
- Leave Tracking
- Market Rates Management
- Month End AR
- Month End Close
-
Reporting
-
ADT Profile Reports
- Action Summary Report
- Cardex Report
- Detailed Census Report
- Length of Stay Report
- Age Summary and Average Age Reports
- Admit/Discharge To/From Report
- Admission Record Report
- Transfer/Discharge Record Report
- Transfer/Discharge Record *NEW* Report
- Resident List Report
- Resident List Report "New"
- Birthday List Report
- Language List Report
- Resident External Facilities Setup Report
- Religion List Report
- Custom Resident Labels Report
- Resident Contacts Report
- Resident Contacts Mailing Labels Report
- Medical Professionals Report
- Medical Professionals Resident Listing Report
- Medical Professionals Mailing Labels Report
- Staff List Report
- Staff Detail Report
- User Defined Information Report
- Facility Common Codes Report
- Online Documentation Storage Report
- General Notes Report
- Assessment Reports
-
Billing Reports
- Bill Groups Report
- Billing Messages Report
- Resident Rates Report
- Resident Rent Roll Report
- Resident Rent Report
- Bed Hold/LOA Days Remaining Report
- Payer Setup Information Report
- Recurring Transactions Report
- GL Account Number History Report
- Transaction Report New
- Transaction History Report
- Payer Billing Log Report
- Print Statements Report
- Statements *New* Report
- Revenue Reconciliation Report
- A/R Aging *New* Report
- A/R Reconciliation Report
- Cash Receipts Journal
- Journal Entries Report
- Management Console Bank Deposit Report
- Revenue Journal Report
- Service Utilization Report
- Point of Care Billing Report
- Letters Reports
- Trust Reports
- Security Reports
-
ADT Profile Reports
- Resident Entry
- Resident Profile & Identifier
- Security
- Statement Billing
- Tax Letters
-
Trust
- Trust Setup
- Trust Profile
-
Trust Portal
- Trust Portal Overview
- Control Accounts
- Current Posting Period/Recurring Batches
-
Trust Batches
-
Overview
- Open Trust Batches Overview
- Creating a Trust Batch
- Editing Trust Batches
- Using Edit all in Trust Batches
- Trust Portal - Open Trust Batches Print
- Trust Portal - Open Trust Batches Post
- Trust Portal - Open Trust Batches Delete
- Trust Portal - Open Trust Batches Copy
- Trust Portal - Open Trust Batches Receipts
-
Overview
- Creating Trust Interest Batches
- Pay Bills From Trust Batches
- Cash Box
- Trust Statements
- Reconciling and Closing Trust
-
Rate Enhanced Billing
-
Configuring Enhanced Rates
- Benefits of New Rate Configuration
- Canadian Rate Transition Quick Reference
- Creating Room Rate Type Categories
- Creating Room Rate Types
- Assigning Room Rate Types in Room Listing
- Mapping Room Rate Type Relationship
- Updating Payer Setup for Rate Enhanced Billing
- Activating Payers
- Creating Care Level Templates
- Creating Schedules
- Mapping Schedule/Status by Payer
- Creating Rate Templates
- Completing Payer Rules
- Managing Payer Rules and Rate Schedules
- Transition to Enhanced Billing
- Reviewing the Enhanced Billing Transition (EBT) Census Entry
- Configuration for Adjustment Batches
- Managing Statement Configuration
-
Using Rate Enhanced Billing
- Using Previous\Current Census Rates
- Using New Fields in Census Entries
- Selecting Additional Location
- Reviewing the Enhanced Billing Transition (EBT) Census Entry
- Using Quick ADT with Enhanced Billing
- Creating Rates for Residents on Subsidy
- Creating Recurring Charges Using Generate Transactions
- Billing Portal
- A La Carte
- Market Rates Management
- Outpatients
- Tax Letters
- Reconciling Month End
- Reports
-
Configuring Enhanced Rates
- The Pulse Quick Reference Guide
-
Accounts Receivable (Billing) Setup
-
General Ledger/Accounts Payable
- GL/AP Configuration
-
Accounts Payable Invoices
- Overview and Accessing Invoices
-
AP Invoice Entry and Recurring Invoices
-
Entering an Invoice Batch
- Invoice Links Overview
- Invoices and Credit Memos Overview
- Creating New Invoice Batch
- Entering Invoices/Credit Memos at the Facility Level
- Reviewing Payable Entries
- Editing Invoice Batch
- Editing Invoice Entries
- Correcting an Entry Type Correction: Invoice vs. Credit Memo
- Deleting Invoice Entries
- Posting Invoice Batch
- Frequently Asked Questions for Invoices
- Recurring Batches
- Accounts Payable Reports
- Expiring Discounts Report
-
Entering an Invoice Batch
- Invoice Filter
- Head Office Invoice Filter
-
AP Payments and Reversals
-
System Payments
- Payments Overview
- Creating a New System Payment Batch
- Adding Invoices to System or Manual Batch
- Editing Payments
- Payments Report
- Deleting Payments
- Generating Payments Printable View
- Printing and Posting GP/AP Payments
- Reprinting Checks
- Generating a Check Copy
- Troubleshooting Common Errors for AP Payments
- Setting up, Processing, and Creating Credit Card Payments
- Setting up and Processing Credit Card Payments Quick Reference Guide
- System Payments Quick Reference Guide
- Reprint
-
Manual Payments
- Creating New Manual Payment Batch
- Adding Invoices to System or Manual Batch
- Creating New Manual Check
- Generating No Vendor Option
- Creating a Misc Payment with No Invoice
- Editing Payments
- Payments Report
- Deleting Payments
- Generating Payments Printable View
- Reprinting Checks
- Generating a Check Copy
- Manual Payments Quick Reference Guide
- Reversals
- Accounts Payable Reports
-
System Payments
- GL Processing and Reports
-
Financial Statements
- Financial Statements Overview
- Creating an Account Group
- Creating a Days/Units Account Group
- Copying and Creating a Summary Account Group
- Custom Reports Overview
- Creating a Report
- Editing Reports to Assign Account Groups and Columns
- Setting the Report Layout
- Analyzing Custom Financial Reports
- Generating a Financial Report
- Creating a Custom Cash Flow Report in GL/AP
- Month End and Bank Reconciliation
- Year End Procedures Overview
-
Customer Relationship Management
- Overview of Customer Relationship Management (CRM)
- CRM Activation
- Security
- CRM Setup
- Organization Setup
- Preferences
-
Customer Relationship Management (CRM) Leads
- Creating a New CRM Lead
- Completing Additional Information for a CRM Lead
- Completing Mandatory Activities
- Creating Contacts for a CRM Lead
- Creating Accounts for a CRM Lead
- Creating Activities for a CRM Lead
- Adding Predefined Activities for a CRM Lead
- Printing Activity Notes for a CRM Lead
- Viewing Lead History for a CRM Lead
- Selecting Possible Placements for a CRM Lead
- Adding/Uploading Misc Documents for a CRM Lead
- Completing Assessments in CRM Lead Details
- Navigating the Lead Listing
- Closing a CRM Lead
- Re-opening a CRM Lead
- Contacts
- Accounts
- Activities
- Availability and Occupancy (A&O)
-
Dashboards and Reports
-
CRM System Dashboards
- Overview of CRM Dashboard
- Conversion Rate by Facility (system) Dashboard
- Activities by Status (system) Dashboard
- Lost/Denied Leads by Facility (system) Dashboard
- Leads by Referral Account (system) Dashboard
- Leads by Sales Cycle (System) Dashboard
- Top Sales Rep (System) Dashboard
- Potential Revenue by Facility (system) Dashboard
-
CRM Reports
- Legacy Reports
- Creating Custom Reports
- Lead Conversion Report
- Tour Conversion Report
- Referrals Analysis By Account Report
- Referrals Analysis by Facility Report
- Referrals by Account Report
- Referrals Status by Account Report
- Lead Status by Owner Report
- Leads by Sales Cycle Report
- Lost Leads by Competitor Report
- Leads by Source Report
-
CRM System Dashboards
- Installing Customer Relationship Management (CRM) Apps on an iOS Device Quick Reference Guide
- Installing Customer Relationship Management (CRM) Apps on an Android Device Quick Reference Guide
- IRM to CRM Migration
-
Using PointClickCare: Videos
- The Basics Videos
-
Clinical Videos
- Allergies Videos
- Care Plan Videos
- EHR Scorecard Videos
- eINTERACT Videos
- eMAR Videos
-
Integrated Medication Management (IMM) Videos
- Integrated Medication Management Overview
- Best Practices for Monitoring: Video
- Messages Overview
- Status Progression Medications
- Reorder or Refill from Pharmacy
- Order Supply Summary
- Order Confirmation
- Supplies On-Order (Electronic)
- Electronically Receiving Supplies
- Order Entry with IMM and Fax Requirements
- Therapeutic Interchange
- Reviewing Orders in the Follow-up Tab
- Updating a Supply Record
- Supplies Returned to Pharmacy
- Residents to be Matched
- Mapping a Resident
- No Match Found Troubleshooting
- Ordered Medication not Delivered Troubleshooting
- Cleaning Up the Orders Portal
- Immunizations Videos
- LTC eConnect Videos
-
MDS 2.0 Videos
- Creating and Copying MDS Assessment
- RUG Optimizer
- Populating Data in the MDS 2.0
- Data Entry and Completing Sections
- Section V - Narrative CAPs/RAPs
- Section V - RAPs Worksheet
- In Progress View (MDS Portal)
- Create Contact Information File
- Create and Export a Batch
- Recording and Revising Recorded Results
- Correct Assessment with Effective Date Prior to April 1, 2012
- Delete Accepted MDS Assessments
- Medical Diagnosis Videos
- Orders Videos
- Point of Care (POC) Videos
- Point of Care (POC) Task Management Videos
- Progress Notes Videos
- Resident Data Videos
- Resident Event Calendar Videos
- Risk Management Videos
- Skin & Wound Videos
- Therapy Minutes Videos
- Weights and Vitals Videos
- Admin Videos
-
General Ledger/Accounts Payable Videos
- AP Reversals Videos
-
Troubleshooting
- AP Clerk
- Accountant
-
Configuration
- How to Set Up Head Office
- How to Add a New Facility to Head Office Configuration
- How to Correct or Change PDF Check Layout
- How to Close Month in GLAP
- How to Create New Fiscal Year
- How to Record Adjusting Entry to Closed Year
- How to Create Account Groups Subgroups and Assign Account Numbers
- How to Complete Bank Reconciliation
- Troubleshooting
- Release Newsletters
- Other Documents
This screen contains items required to navigate the Skin & Wound Dashboard.
Wounds Dashboard
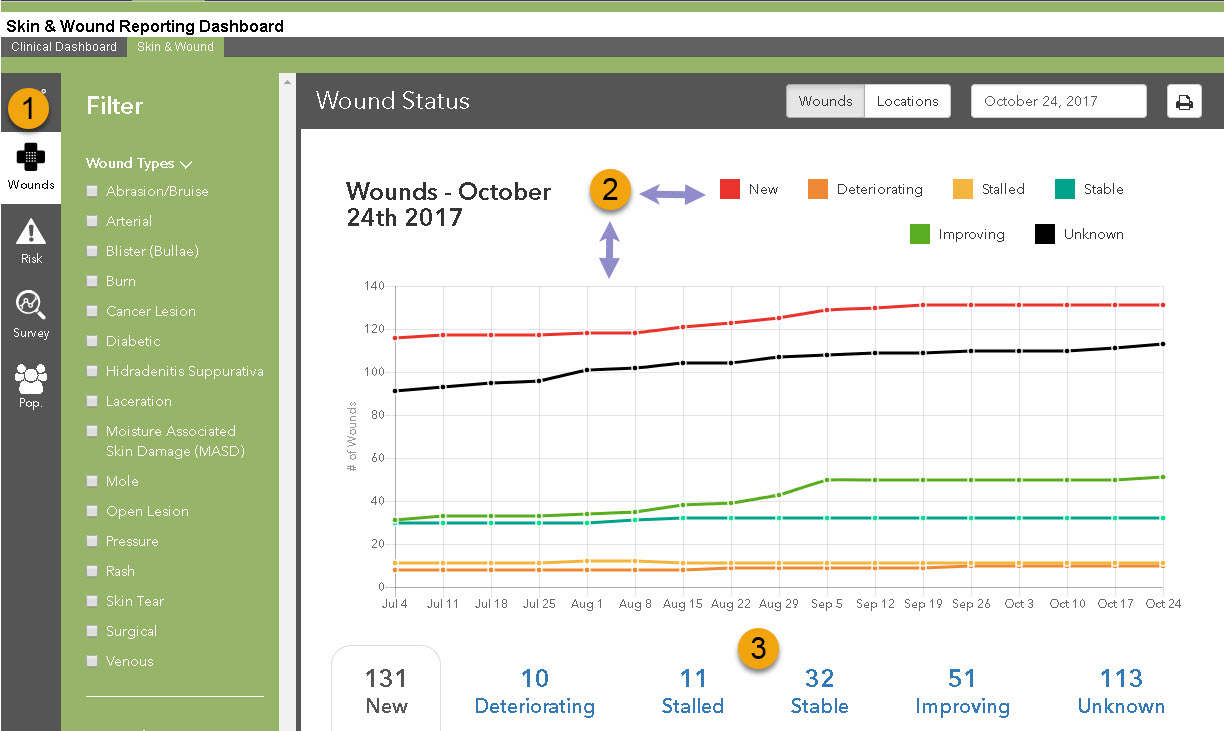
|
Item Number |
Item Name |
Description |
|---|---|---|
| 1. |
Wounds Dashboard |
Click to view and sort by wound type and wound status for residents in your facility. |
| 2. |
Wounds Legend/Graph |
Legend: View color coding legend associated with wound graph. Graph: Hover to view details of wounds on a specific date. |
| 3. |
Wound Status |
Click to view wound documentation in the facility. Click each resident to view detailed wound documentation on the resident chart. |
Risk Dashboard
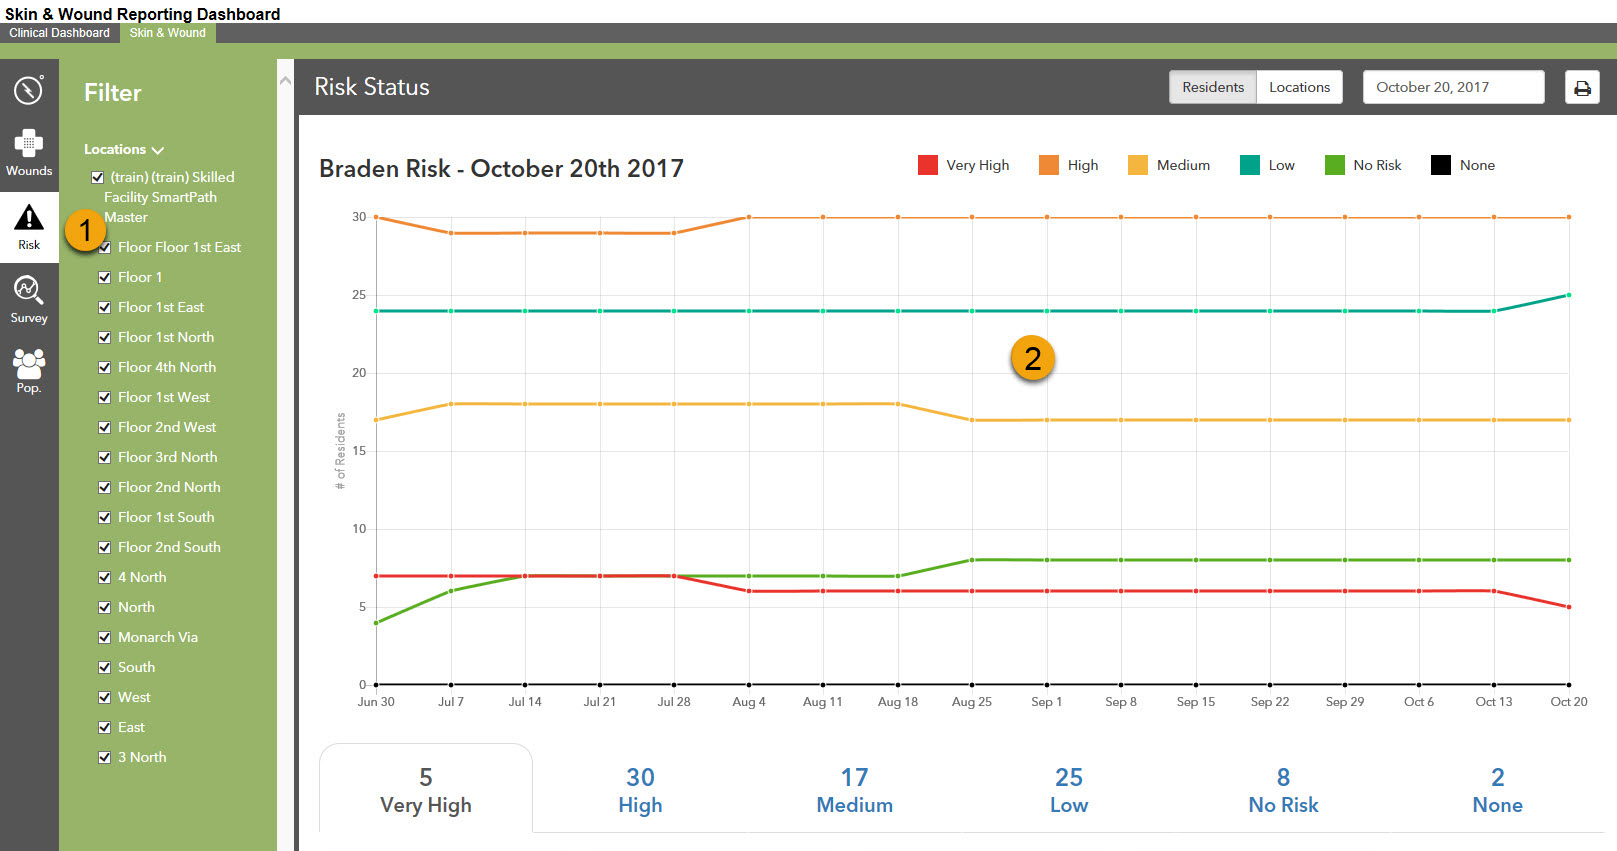
|
Item Number |
Item Name |
Description |
|---|---|---|
| 1. |
Risk Dashboard |
Click to view and sort Braden Risk wound assessments by status. |
| 2. |
Braden Risk Graph |
Hover to view details of risk assessments on specific dates. |
Survey Dashboard
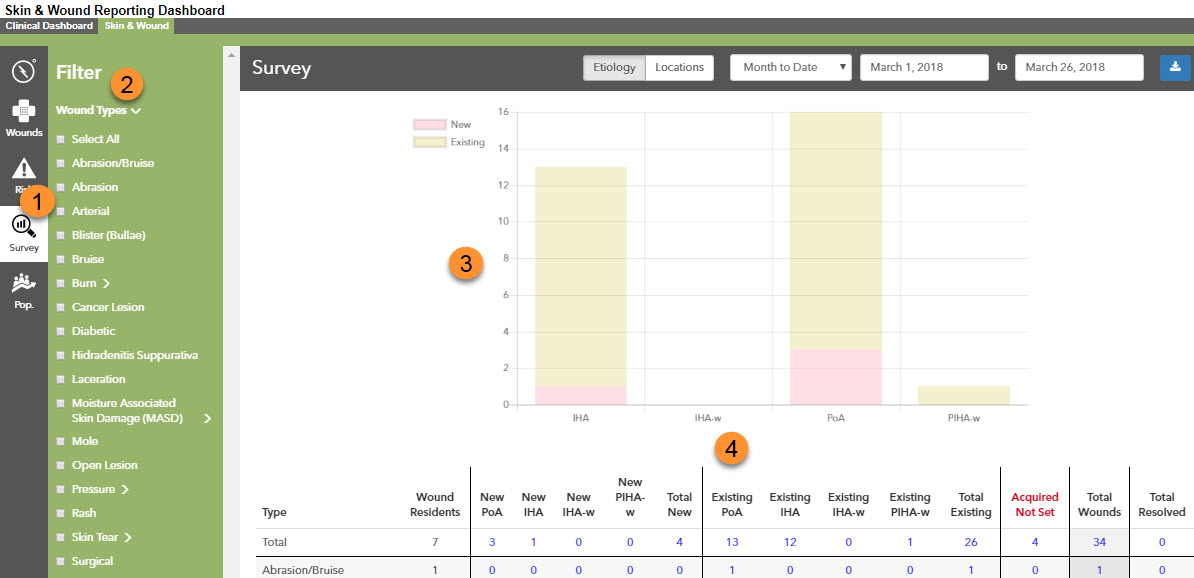
|
Item Number |
Item Name |
Description |
|---|---|---|
| 1. |
Survey Dashboard |
Click to view and sort by wound type, assessments, incidence, prevalence and total in each location. |
| 2. |
Wound Type Filters |
Select wound type(s) or Select All. |
| 3. |
Surveillance Graphs |
Hover to view totals for new and existing wounds. |
| 4. |
Wound Tally Table |
Present on Admission (PoA): View wound totals present before admission. In-House Acquired (IHA): View wound totals acquired in the facility. In-House Acquired - Worsening (IHA-w): View wound totals acquired in the facility and in a worsened condition. Present on Admission In-House Acquired - Worsening (PIHA-w): View wound totals present on admission, in the facility that have worsened. Acquired Not Set: View wounds that are not categorized. New Wounds: View new wound totals. Existing Wounds: View wound totals that are diagnosed and documented. |
Population Dashboard
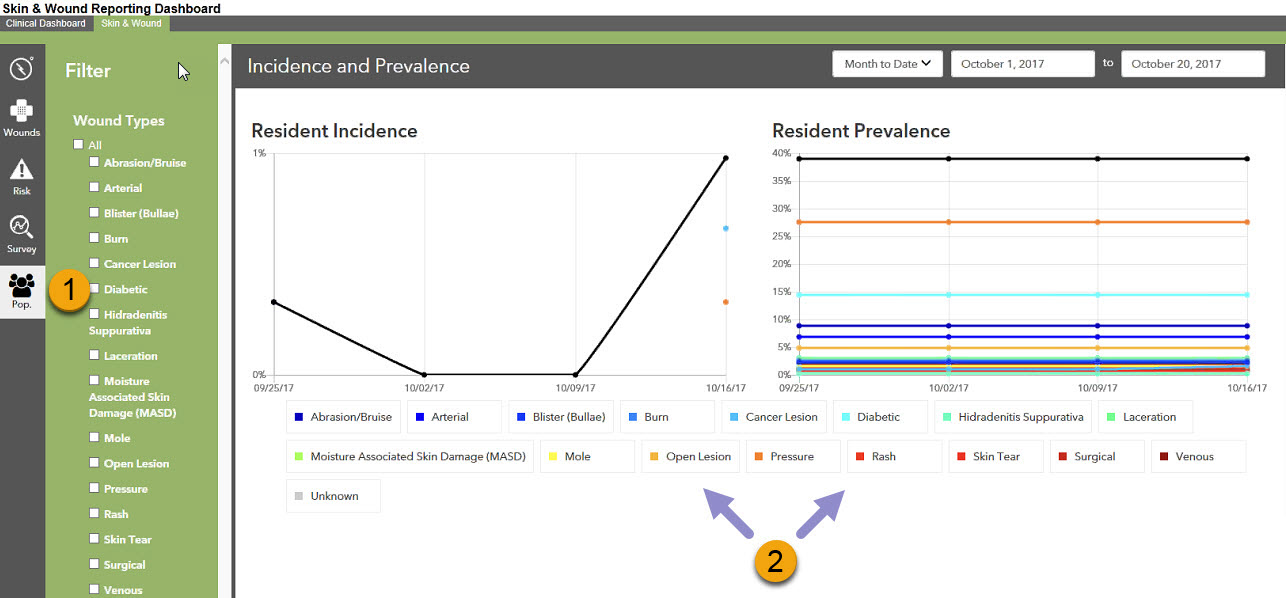
|
Item Number |
Item Name |
Description |
|---|---|---|
| 1. |
Population Dashboard (Pop.) |
Click to view and sort by wound type of new wound incidence and total wound prevalence for the entire facility. |
| 2. |
Incidence and Prevalence Graphs |
Resident Incidence Graph: Hover to view date and percentage of new wound Incidence for total resident population. Resident Prevalence Graph: Hover to view date and percentage of all wounds for resident population. |